R绘图方面是非常方便的,今天给大家介绍一下特色箱型图的绘制方法,主要也是利用R绘图神器ggplot2绘制。
1)箱型图+点图组合图,绘制方法如下:
library(ggplot2)
library(ggthemes)
library(dplyr)

# 设置默认主题
theme_set(theme_few())

# 绘图

# 采用mpg数据集
mpg %>%
ggplot(aes(manufacturer, cty)) +
  # 盒装图
  geom_boxplot() +
  # 点图
  geom_dotplot(
    binaxis = 'y',
    stackdir = 'center',
    dotsize = .5,
    colour = "white",
    fill = "red"
  ) +
  # 设置x轴标签旋转角度
  theme(axis.text.x = element_text(angle = 45, vjust = 0.6)) +
  labs(
    title = "Box plot + Dot plot",
    x = "Class of Vehicle",
    y = "City Mileage"
  )
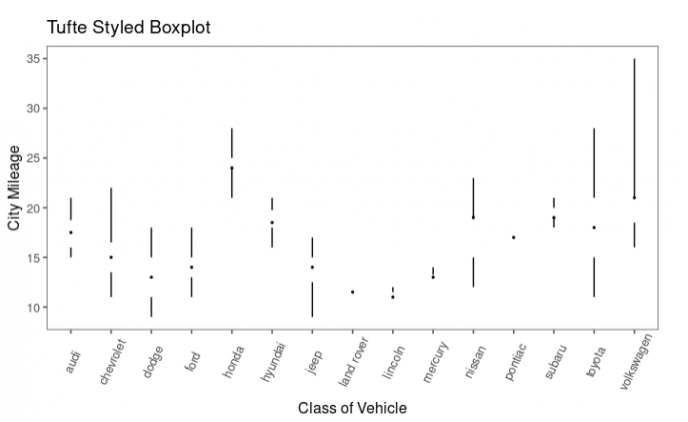
2)Tufte风格的箱型图,其主要优势是呈现了所有箱型图的特征同时占用更少的空间,适合多样本的箱型图的展示,如下:
library(ggthemes)
library(ggplot2)
library(dplyr)

theme_set(theme_few())

# 采用mpg数据集
mpg %>%
  ggplot(aes(manufacturer, cty)) +
  geom_tufteboxplot() +
  theme(axis.text.x = element_text(angle = 65, vjust = 0.6)) +
  labs(title = "Tufte Styled Boxplot",
       x = "Class of Vehicle",
       y = "City Mileage")
参考资料:
1.https://r-statistics.co/Top50-Ggplot2-Visualizations-MasterList-R-Code.html

 浙公网安备 33010802011761号