前两篇介绍了简单绘制热图和柱状图的绘制,circos <plot>...</plot>本身绘图支持scatter,line,histogram,heatmap,highlight,tile,text,connector 8种形式的绘制方法。本文是基于前两篇教程讲解,如果你还不了解之前的内容请查看:
本篇教程主要介绍,点图、折线图和磁贴图的绘制(如果你仔细研究和练习前两篇,本文上手难度就很低了),以下 <plot>...</plot> 块均位于<plots>...</plots>块中,为了精简文章结构,本文不在赘述conf文件。
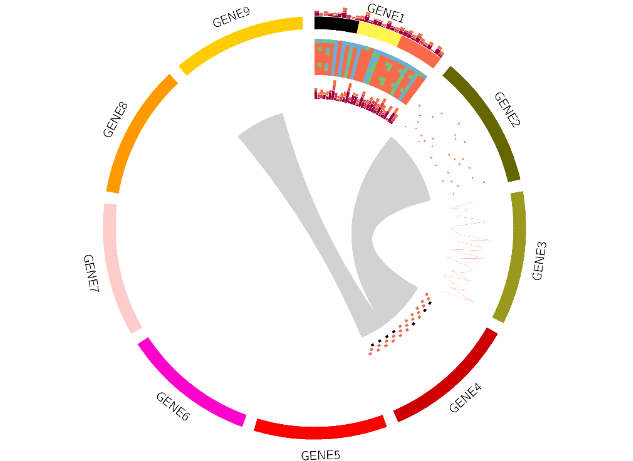
1)添加点图
# 绘制点图
<plot>

show  = yes
# 类型,必须指定
type  = scatter
# 数据文件
# 格式:标签 起始位置 结束位置 值
file  = scatter.txt
r1    = 0.40r
r0    = 0.65r
# 指定最大值、最小值,也可以忽略
max   = 1.0
min   = 0.0

# 定义点的类型、大小和颜色等
glyph            = rectangle
glyph_size       = 8
color            = red
stroke_color     = dred
stroke_thickness = 1

</plot>2)添加折线图
# 绘制折线图
<plot>

show  = yes
type  = line

file  = line.txt
r1    = 0.40r
r0    = 0.65r
max   = 1.0
min   = 0.0

glyph            = rectangle
glyph_size       = 8
color            = red
stroke_color     = dred
stroke_thickness = 1

</plot>3)添加磁贴图
# 绘制磁贴图
<plot>

type            = tile
layers_overflow = hide

file        = tile.txt
r1          = 0.85r
r0          = 0.65r
orientation = out

layers      = 15
margin      = 0.02u
thickness   = 15
padding     = 8

stroke_thickness = 1
stroke_color     = grey
</plot>到此我们 <plots>...</plots> 块中大部分的绘图方法已经讲解完毕了,目前来看其主要难度在数据格式的理解和配置文件的编写上面,所以在动手前先了解数据结构是很有必要的。
参考资料:
1.http://circos.ca/documentation/tutorials/
