偶然看见大神再网上分享花瓣图代码(https://www.cnblogs.com/xudongliang/p/7884667.html),觉得很漂亮,于是修改了下使其更加方便。此间遇见颜色修改问题,略作修改,又见科学网刘尧也有相关文章描述,遂一并分享给大家。
# 加载包
library(plotrix)
library(RColorBrewer)
# 本函数来自https://www.cnblogs.com/xudongliang/p/7884667.html
# 此处也有修改示例http://blog.sciencenet.cn/blog-3406804-1159241.html
flower_plot <- function(sample, # 样本名称
value, # 对应数量
start, # 起始
a, # 设置花瓣椭圆的尺寸:a轴,b轴
b,
r, # 中间圆大小
overlap, # 所有的样本交集数量
ellipse_col = color.scale(value, alpha=0.5, color.spec= "rgb"), # 椭圆颜色
circle_col = "green", # 中心圆颜色
# 字体大小
circle_text_cex = 1) {
par(
bty = "n",
ann = F,
xaxt = "n",
yaxt = "n",
mar = c(1, 1, 1, 1)
)
plot(c(0, 10), c(0, 10), type = "n")
n <- length(sample)
deg <- 360 / n
res <- lapply(1:n, function(t) {
draw.ellipse(
x = 5 + cos((start + deg * (t - 1)) * pi / 180),
y = 5 + sin((start + deg * (t - 1)) * pi / 180),
col = ellipse_col[t],
border = ellipse_col[t],
a = a,
b = b,
angle = deg * (t - 1)
)
text(x = 5 + 2.5 * cos((start + deg * (t - 1)) * pi / 180),
y = 5 + 2.5 * sin((start + deg * (t - 1)) * pi / 180),
value[t])
if (deg * (t - 1) < 180 && deg * (t - 1) > 0) {
text(
x = 5 + 3.3 * cos((start + deg * (t - 1)) * pi / 180),
y = 5 + 3.3 * sin((start + deg * (t - 1)) * pi / 180),
sample[t],
srt = deg * (t - 1) - start,
adj = 1,
cex = circle_text_cex
)
} else {
text(
x = 5 + 3.3 * cos((start + deg * (t - 1)) * pi / 180),
y = 5 + 3.3 * sin((start + deg * (t - 1)) * pi / 180),
sample[t],
srt = deg * (t - 1) + start,
adj = 0,
cex = circle_text_cex
)
}
})
draw.circle(
x = 5,
y = 5,
r = r,
col = circle_col,
border = circle_col
)
text(x = 5, y = 5, paste('Core: ', overlap))
}
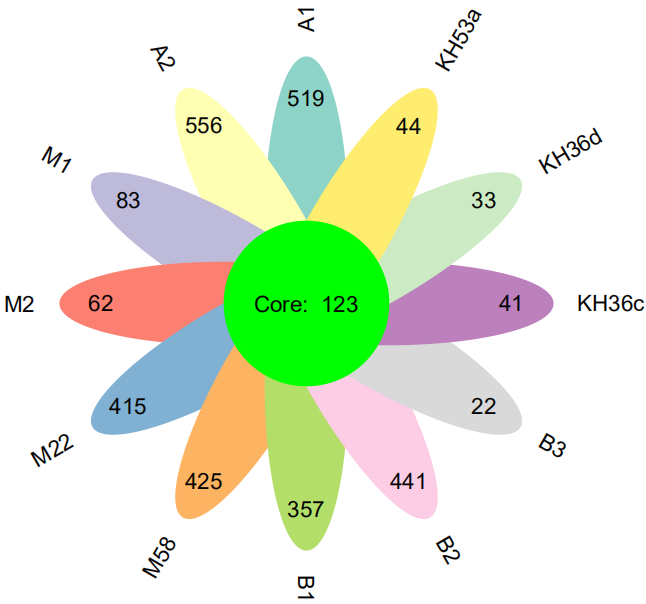
A <- c("A1", "A2", "M1", "M2", "M22", "M58", "B1", "B2", "B3", "KH36c", "KH36d", "KH53a")
A.data <- c(519, 556, 83, 62, 415, 425, 357, 441, 22, 41, 33, 44)
# 定义颜色
A.col <- brewer.pal(12, "Set3")
pdf("flower_plot.pdf")
flower_plot(A, A.data, 90, 0.5, 2, 1, 123, ellipse_col = A.col)
dev.off()如上,供大家参考。另外plotrix包也是一个用途很广泛的R包。像双坐标轴、断层柱状图等都可以用它来绘制。
参考文章:
1.https://www.cnblogs.com/xudongliang/p/7884667.html
