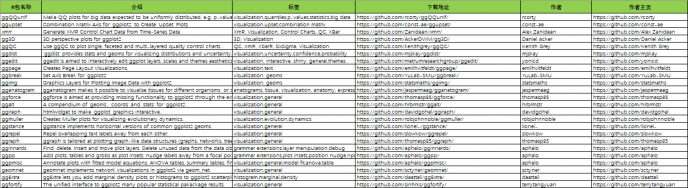
ggplot2现在已经成为R绘图可视化的主要包,现在将目前大部分基于ggplot2开发的R包汇总如下:
| R包名称 | 介绍 | 标签 | 下载地址 | 作者 | 作者主页 |
| ggQQunif | Make QQ plots for big data expected to be uniformly distributed, e.g. p-v alues. | visualization,quantiles,p-values,statistics,big data | https://github.com/rcorty/ggQQunif/ | rcorty | https://github.com/rcorty |
| ggupset | Combination Matrix Axis for ‘ggplot2’ to Create ‘UpSet’ Plots | visualization,upset,combination matrix | https://github.com/const-ae/ggupset/ | const-ae | https://github.com/const-ae |
| xmrr | Generate XMR Control Chart Data from Time-Series Data. | XmR, Visualization, Control Charts, QC, XBar | https://github.com/Zanidean/xmrr/ | Alex Zanidean | https://github.com/Alex Zanidean |
| gg3D | 3D perspective plots for ggplot2 | 3D, Visualization | https://github.com/AckerDWM/gg3D/ | Daniel Acker | https://github.com/Daniel Acker |
| ggQC | Use ggQC to plot single, faceted and multi-layered quality control charts . | QC, XmR, XbarR, SixSigma, Visualization | https://github.com/kenithgrey/ggQC/ | Kenith Grey | https://github.com/Kenith Grey |
| ggdist | ‘ggdist’ provides stats and geoms for visualizing distributions and uncertain ty. | visualization,uncertainty,confidence,probability | https://github.com/mjskay/ggdist/ | mjskay | https://github.com/mjskay |
| ggedit | ggedit is aimed to interactively edit ggplot layers, scales and themes aesth etics | visualization, interactive, shiny, general,themes | https://github.com/metrumresearchgroup/ggedit/ | yonicd | https://github.com/yonicd |
| ggpage | Creates Page Layout Visualizations. | visualization,text | https://github.com/emilhvitfeldt/ggpage/ | emilhvitfeldt | https://github.com/emilhvitfeldt |
| ggbreak | Set Axis Break for ‘ggplot2’ | visualization, geoms | https://github.com/YuLab-SMU/ggbreak/ | YuLab-SMU | https://github.com/YuLab-SMU |
| ggimg | Graphics Layers for Plotting Image Data with ggplot2. | visualization, geoms | https://github.com/statsmaths/ggimg/ | statsmaths | https://github.com/statsmaths |
| gganatogram | gganatogram makes it possible to visualise tissues for different organisms or cell compartments. | anatograms, tissue, visualization, anatomy, expr ession, pharmacology | https://github.com/jespermaag/gganatogram/ | jespermaag | https://github.com/jespermaag |
| ggforce | ggforce is aimed at providing missing functionality to ggplot2 through the extension system introduced with ggplot2 v2.0.0. | visualization,general | https://github.com/thomasp85/ggforce/ | thomasp85 | https://github.com/thomasp85 |
| ggalt | A compendium of ‘geoms’, ‘coords’ and ‘stats’ for ‘ggplot2’. | visualization,general | https://github.com/hrbrmstr/ggalt/ | hrbrmstr | https://github.com/hrbrmstr |
| ggiraph | htmlwidget to make ‘ggplot’ graphics interactive. | visualization,general | https://github.com/davidgohel/ggiraph/ | davidgohel | https://github.com/davidgohel |
| ggmuller | Creates Muller plots for visualizing evolutionary dynamics. | visualization,evolution,dynamics | https://github.com/robjohnnoble/ggmuller/ | robjohnnoble | https://github.com/robjohnnoble |
| ggstance | ggstance implements horizontal versions of common ggplot2 geoms. | visualization,general | https://github.com/lionel-/ggstance/ | lionel- | https://github.com/lionel- |
| ggrepel | Repel overlapping text labels away from each other. | visualization,general | https://github.com/slowkow/ggrepel/ | slowkow | https://github.com/slowkow |
| ggraph | ggraph is tailored at plotting graph-like data structures (graphs, networks, trees, hierarchies…). | visualization,general | https://github.com/thomasp85/ggraph/ | thomasp85 | https://github.com/thomasp85 |
| gginnards | Find, delete, insert and move plot layers. Delete unused data from the data object stored within a ggplot object. Dump data to the R console. | grammar extensions,layer manipulation,debug | https://github.com/aphalo/gginnards/ | aphalo | https://github.com/aphalo |
| ggpp | Add plots, tables and grobs as plot insets; nudge labels away from a focal point or line; filter observations by local density. | grammar extensions,plot insets,position nudge, npc | https://github.com/aphalo/ggpp/ | aphalo | https://github.com/aphalo |
| ggpmisc | Annotate plots with fitted model equations, ANOVA tables, summary table s; find and label peaks and valleys; annotations support grouping and facets. | visualization,general,model fit,anova,table | https://github.com/aphalo/ggpmisc/ | aphalo | https://github.com/aphalo |
| geomnet | geomnet implements network visualizations in ggplot2 via geom_net. | visualization,general | https://github.com/sctyner/geomnet/ | sctyner | https://github.com/sctyner |
| ggExtra | ggExtra lets you add marginal density plots or histograms to ggplot2 scatt erplots. | histogram,marginal,density | https://github.com/daattali/ggExtra/ | daattali | https://github.com/daattali |
| ggfortify | The unified interface to ggplot2 many popular statistical pakackage results. | visualization,general | https://github.com/sinhrks/ggfortify/ | terrytangyuan | https://github.com/terrytangyuan |
| autoplotly | Automatic generation of interactive visualizations for popular statistical res ults. | visualization,general | https://github.com/terrytangyuan/autoplotly/ | terrytangyuan | https://github.com/terrytangyuan |
| gganimate | A Grammar of Animated Graphics. | visualization,general | https://github.com/thomasp85/gganimate/ | thomasp85 | https://github.com/thomasp85 |
| ggfx | Pixel Filters for ‘ggplot2’ and ‘grid’ | visualization,general | https://github.com/thomasp85/ggfx/ | thomasp85 | https://github.com/thomasp85 |
| plotROC | plotROC provides functions to generate an interactive ROC curve plot for web use, and print versions. | visualization,general | https://github.com/sachsmc/plotROC/ | sachsmc | https://github.com/sachsmc |
| ggbump | Bump Chart and Sigmoid Curves. | visualization,general,geoms | https://github.com/davidsjoberg/ggbump/ | davidsjoberg | https://github.com/davidsjoberg |
| ggthemes | Some extra geoms, scales, and themes for ggplot. | visualization,general,themes | https://github.com/jrnold/ggthemes/ | jrnold | https://github.com/jrnold |
| ggspectra | ‘ggspectra’ extends ‘ggplot2’ with stats, geoms and annotations for plottin g light spectra. | visualization,general | https://github.com/jrnold/ggthemes/ | aphalo | https://github.com/aphalo |
| ggstatsplot | ‘ggstatsplot’ provides a collection of functions to enhance ‘ggplot2’ plots with results from statistical tests. | visualization,statistics | https://github.com/IndrajeetPatil/ggstatsplot/ | IndrajeetPatil | https://github.com/IndrajeetPatil |
| ggnetwork | The ggnetwork package provides a way to build network plots with ggplo t2. | visualization,general | https://github.com/briatte/ggnetwork/ | briatte | https://github.com/briatte |
| ggtech | ggplot2 tech themes, scales, and geoms. | visualization,general,themes | https://github.com/ricardo-bion/ggtech/ | ricardo-bion | https://github.com/ricardo-bion |
| ggradar | ggradar allows you to build radar charts with ggplot2. | visualization,general | https://github.com/ricardo-bion/ggradar/ | ricardo-bion | https://github.com/ricardo-bion |
| ggx | A Natural Language Interface to ‘ggplot2’. | visualization,nlp | https://github.com/brandmaier/ggx/ | brandmaier | https://github.com/brandmaier |
| ggTimeSeries | This R package offers novel time series visualisations. | visualization,general | https://github.com/Ather-Energy/ggTimeSeries/ | Ather-Energy | https://github.com/Ather-Energy |
| ggtree | gtree is designed for visualizing phylogenetic tree and different types of as sociated annotation data. | visualization,general | https://github.com/GuangchuangYu/ggtree/ | GuangchuangYu | https://github.com/GuangchuangYu |
| ggseas | Seasonal adjustment on the fly extension for ggplot2. | visualization,general | https://github.com/ellisp/ggseas/ | ellisp | https://github.com/ellisp |
| ggsci | A collection of ‘ggplot2’ color palettes inspired by scientific journals and sc ience fiction TV shows. | visualization,general | https://github.com/road2stat/ggsci/ | road2stat | https://github.com/road2stat |
| ggmosaic | ggmosaic implements mosaic plots in ‘ggplot2’ via geom_mosaic. | visualization,general | https://github.com/haleyjeppson/ggmosaic/ | haleyjeppson | https://github.com/haleyjeppson |
| survminer | Drawing Survival Curves using ‘ggplot2’ | visualization,survival | https://github.com/kassambara/survminer/ | kassambara | https://github.com/kassambara |
| ggeasy | Easy Access to ‘ggplot2’ Commands | visualization,teaching | https://github.com/jonocarroll/ggeasy/ | jonocarroll | https://github.com/jonocarroll |
| ggside | Side Grammar Graphics | visualization,correlation | https://github.com/jtlandis/ggside/ | jtlandis | https://github.com/jtlandis |
| ggcorrplot | Visualization of a correlation matrix using ‘ggplot2’ | visualization,correlation | https://github.com/kassambara/ggcorrplot/ | kassambara | https://github.com/kassambara |
| ggpubr | ‘ggplot2’ Based Publication Ready Plots | visualization,statistics | https://github.com/kassambara/ggpubr/ | kassambara | https://github.com/kassambara |
| ggthemr | Themes for ggplot | visualization,general,themes | https://github.com/cttobin/ggthemr/ | cttobin | https://github.com/cttobin |
| GGally | ggally extends ‘ggplot2’ by adding several functions to reduce the comple xity of combining geometric objects with transformed data. | visualization,general | https://github.com/ggobi/ggally/ | ggobi | https://github.com/ggobi |
| ggseqlogo | Publication-ready sequence logos using ggplot2. | visualization,general | https://github.com/omarwagih/ggseqlogo/ | omarwagih | https://github.com/omarwagih |
| ggChernoff | Visualise multivariate data using human faces | visualization | https://github.com/Selbosh/ggChernoff/ | Selbosh | https://github.com/Selbosh |
| ggridges | Ridgeline plot geoms for ‘ggplot2’ | visualization,general | https://github.com/clauswilke/ggridges/ | clauswilke | https://github.com/clauswilke |
| lemons | Repositioning legends and adding brackets to axes to ‘ggplot2’. | visualization,brackets,axis | https://github.com/stefanedwards/lemon/ | stenfanedwards | https://github.com/stenfanedwards |
| cowplot | Streamlined plot theme and plot annotations for ‘ggplot2’ | visualization,general,themes | https://github.com/wilkelab/cowplot/ | clauswilke | https://github.com/clauswilke |
| qqplotr | Quantile-quantile and probability-probability plot extensions for ‘ggplot2’ | quantile-quantile,probability-probability | https://github.com/aloy/qqplotr/ | almeidaxan | https://github.com/almeidaxan |
| ggalluvial | A ‘ggplot2’ extension for alluvial diagrams. | visualization,categorical,time series | https://github.com/corybrunson/ggalluvial/ | corybrunson | https://github.com/corybrunson |
| patchwork | Easy composition of ggplot plots using arithmetic operators | visualization,composition | https://github.com/thomasp85/patchwork/ | thomasp85 | https://github.com/thomasp85 |
| ggquiver | Quiver/velocity plots for ‘ggplot2’. | visualization,quiver,velocity,vector | https://github.com/mitchelloharawild/ggquiver/ | mitchelloharawild | https://github.com/mitchelloharawild |
| ggsignif | Significance Brackets for ‘ggplot2’. | visualization,multiple comparisons | https://github.com/const-ae/ggsignif/ | const-ae and IndrajeetPatil | https://github.com/const-ae and Ind rajeetPatil |
| ggdag | Causal directed acyclic graphs (DAGs) in <code highlighter-rouge”>ggplot2</code> | visualization,dags,inference | https://github.com/malcolmbarrett/ggdag/ | malcolmbarrett | https://github.com/malcolmbarrett |
| ggformula | <code class=”language-plaintext highlighter-rouge”>ggplot2</code> via formulas and pipes | visualization,general,interface | https://github.com/ProjectMOSAIC/ggformula/ | rpruim | https://github.com/rpruim |
| ggbeeswarm | Create beeswarm plots, which avoids overlapping datapoints. | visualization, beeswarm, categorical | https://github.com/eclarke/ggbeeswarm/ | Erik Clarke and Scott Sherril l-Mix | https://github.com/Erik Clarke and Sc ott Sherrill-Mix |
| ggperiodic | Automagically augment periodic data in <code style=”display:none”> highlighter-rouge”>ggplot2</code> | visualization,periodic | https://github.com/eliocamp/ggperiodic/ | eliocamp | https://github.com/eliocamp |
| ggpol | ggpol adds parliament diagrams and several other geoms to ggplot2. | visualization,general | https://github.com/erocoar/ggpol/ | erocoar | https://github.com/erocoar |
| ggpirate | Pirate plots for <code highlighter-rouge”>ggpl ot2</code> | visualization | https://github.com/mikabr/ggpirate/ | mikabr | https://github.com/mikabr |
| esquisse | Explore and Visualize Your Data Interactively with plaintext highlighter-rouge”>ggplot2</code> | visualization,interface | https://github.com/dreamrs/esquisse/ | dreamrs | https://github.com/dreamrs |
| ggdark | Dark Mode for <code highlighter-rouge”>ggpl ot2</code> Themes | visualization,general,themes | https://github.com/nsgrantham/ggdark/ | nsgrantham | https://github.com/nsgrantham |
| sugrrants | Supporting Graphs for Analysing Temporal Data with ge-plaintext highlighter-rouge”>ggplot2</code> | visualization,calendar,time-series | https://github.com/earowang/sugrrants/ | earowang | https://github.com/earowang |
| tvthemes | <code class=”language-plaintext highlighter-rouge”>ggplot2</code> Th emes & Palettes from popular TV shows! | visualization,general,palettes,themes | https://github.com/Ryo-N7/tvthemes/ | Ryo-N7 | https://github.com/Ryo-N7 |
| ggfittext | <code class=”language-plaintext highlighter-rouge”>ggplot2</code> ge oms to fit text in a box | visualization,general,text | https://github.com/wilkox/ggfittext/ | wilkox | https://github.com/wilkox |
| ggparty | <code class=”language-plaintext highlighter-rouge”>ggplot2</code> visualizations for the <code class=”language-plaintext highlighter-rouge”>partykit</code> package | visualization,tree,partykit | https://github.com/martin-borkovec/ggparty/ | martin-borkovec | https://github.com/martin-borkovec |
| gggenes | <code class=”language-plaintext highlighter-rouge”>ggplot2</code> ge oms to draw gene arrow maps | visualization,general,genetics | https://github.com/wilkox/gggenes/ | wilkox | https://github.com/wilkox |
| gggenomes | a grammar of graphics for comparative genomics | visualization,genetics,genomics | https://github.com/thackl/gggenomes/ | thackl | https://github.com/thackl |
| treemapify | Draw treemaps in <code highlighter-rouge”>g gplot2</code> | visualization,general,treemap | https://github.com/wilkox/treemapify/ | wilkox | https://github.com/wilkox |
| lindia | Create diagnostics plots for linear regression | visualization,general,diagnostics,regression | https://github.com/yeukyul/lindia/ | yeukyul | https://github.com/yeukyul |
| gghalves | gghalves adds half-geoms to <code highlighter -rouge”>ggplot2</code>. | visualization,general | https://github.com/erocoar/gghalves/ | erocoar | https://github.com/erocoar |
| ggrastr | Rasterize only specific layers of your plot | visualization,raster | https://github.com/vpetukhov/ggrastr/ | vpetukhov | https://github.com/vpetukhov |
| ggpointdensity | Introduces <code highlighter-rouge”>geom_p ointdensity()</code>: A cross between a scatter plot and a 2D density plot. | visualization,general | https://github.com/LKremer/ggpointdensity/ | LKremer | https://github.com/LKremer |
| ggsom | The aim of this package is to offer more variability of graphics based on th e self-organizing maps. | visualization,SOM,multi-dimensional,parallel-co ordinates | https://github.com/oldlipe/ggsom/ | oldlipe | https://github.com/oldlipe |
| ggnewscale | Use multiple fill and colour scales in ‘ggplot2’. | visualization,general,scales | https://github.com/eliocamp/ggnewscale/ | eliocamp | https://github.com/eliocamp |
| ggh4x | Options for tailored facets, multiple colourscales and miscellaneous | visualization,general,scales,facets | https://github.com/teunbrand/ggh4x/ | teunbrand | https://github.com/teunbrand |
| ggcharts | Shorten the distance from data visualization idea to actual plot | visualization,general | https://github.com/thomas-neitmann/ggcharts/ | thomas-neitmann | https://github.com/thomas-neitmann |
| humapr | Visualise topographic human data with choropleths | visualization,general,tabulation,choropleth | https://github.com/benskov/humapr/ | benskov | https://github.com/benskov |
| ggshadow | Draw a shadow below lines to make busy plots more aesthetically pleasing | visualization,general | https://github.com/marcmenem/ggshadow/ | marcmenem | https://github.com/marcmenem |
| ggseg | Draw polygons of brain atlas segmentations | visualization,brain imaging | https://github.com/LCBC-UiO/ggseg/ | Athanasiamo | https://github.com/Athanasiamo |
| mdthemes | ‘ggplot2’ themes that render text as markdown/HTML | visualization,themes | https://github.com/thomas-neitmann/mdthemes/ | thomas-neitmann | https://github.com/thomas-neitmann |
| ggwordcloud | A word cloud text geom for ‘ggplot2’. | visualization,text | https://github.com/lepennec/ggwordcloud/ | lepennec | https://github.com/lepennec |
| ggasym | Asymmetric matrix plotting with multiple scales. | visualization,multi-dimensional,matrix,scales | https://github.com/jhrcook/ggasym/ | jhrcook | https://github.com/jhrcook |
| gglorenz | Plotting Lorenz curves with the blessing of ggplot2. | visualization,general,statistics | https://github.com/jjchern/gglorenz/ | jjchern | https://github.com/jjchern |
| hrbrthemes | A compilation of extra {ggplot2} themes, scales and utilities, including a sp ell check function for plot label fields and an overall emphasis on typography. | theme,typography | https://github.com/hrbrmstr/hrbrthemes/ | hrbrmstr | https://github.com/hrbrmstr |
| ggpattern | Pattern fills for ggplot2 geoms. | visualization,pattern | https://github.com/coolbutuseless/ggpattern/ | coolbutuseless | https://github.com/coolbutuseless |
| ggtext | Improved text rendering support for <code hig hlighter-rouge”>ggplot2</code> | general,theme,typography | https://github.com/clauswilke/ggtext/ | Claus Wilke | https://github.com/Claus Wilke |
| calendR | Ready to Print Monthly and Yearly Calendars | visualization, calendar, time-series | https://github.com/R-CoderDotCom/calendR/ | R-CoderDotCom | https://github.com/R-CoderDotCom |
| ggip | Data visualization of IP addresses and networks | visualization, cyber, space-filling curves | https://github.com/davidchall/ggip/ | davidchall | https://github.com/davidchall |
| gglm | Grammar of Graphics for linear model diagnostic plots. | visualization,modeling,diagnostic | https://github.com/graysonwhite/gglm/ | graysonwhite | https://github.com/graysonwhite |
| econocharts | Microeconomics and Macroeconomics Charts | economics, microeconomics, macroeconomics | https://github.com/R-CoderDotCom/econocharts/ | R-CoderDotCom | https://github.com/R-CoderDotCom |
| ComplexUpset | Visualize set intersections and add <code highli ghter-rouge”>ggplot2</code> annotations | visualization,venn,set,intersections,venn-diagra m,upset | https://github.com/krassowski/complex-upset/ | krassowski | https://github.com/krassowski |
| ggchromatic | Colourspace Scales for ‘ggplot2’ | visualization,scales | https://github.com/teunbrand/ggchromatic/ | teunbrand | https://github.com/teunbrand |
| ggheatmap | ggplot2 version of heatmap | visualization, heatmap | https://github.com/XiaoLuo-boy/ggheatmap/ | XiaoLuo-boy | https://github.com/XiaoLuo-boy |
| see | Visualisation Toolbox for ‘easystats’ and Extra Geoms, Themes and Color P alettes for ‘ggplot2’ | visualizations,statistics | https://github.com/easystats/see/ | easystats | https://github.com/easystats |
| directlabels | Framework for adding direct labels to lattice or ggplot2 plots. | visualization, direct-labels, positioning, general, plot-labelling | https://github.com/tdhock/directlabels/ | tdhock | https://github.com/tdhock |
| ggHoriPlot | Horizon Plots for <code highlighter-rouge”>gg plot2</code> | visualization,general,horizon-plot,time-series | https://github.com/rivasiker/ggHoriPlot/ | rivasiker | https://github.com/rivasiker |
| ggtrace | Outline groups of data points using ggplot2 | visualization | https://github.com/rnabioco/ggtrace/ | sheridar | https://github.com/sheridar |
| ggESDA | Exploratory Symbolic Data Analysis with ‘ggplot2’. | visualization,symbolic data,interval-valued data | https://github.com/kiangkiangkiang/ggESDA/ | kiangkiangkiang | https://github.com/kiangkiangkiang |
| geomtextpath | Create curved text and directly label lines in ext highlighter-rouge”>ggplot</code> | typography,plot-labelling,visualization | https://github.com/AllanCameron/geomtextpath/ | AllanCameron | https://github.com/AllanCameron |
| ggdensity | Interpretable bivariate density visualization with highest density regions | visualization,density-estimation | https://github.com/jamesotto852/ggdensity/ | jamesotto852 | https://github.com/jamesotto852 |
| ggtranscript | Visualizing transcript structure and annotation using e-plaintext highlighter-rouge”>ggplot2</code> | visualization,genetics,genomics,transcripts,annot ation | https://github.com/dzhang32/ggtranscript/ | dzhang32 | https://github.com/dzhang32 |
| piecepackr | Board game graphics | board games, geoms | https://github.com/piecepackr/piecepackr/ | trevorld | https://github.com/trevorld |
| oblicubes | 3D Rendering Using Obliquely Projected Cubes and Cuboids | visualization, geoms | https://github.com/trevorld/oblicubes/ | trevorld | https://github.com/trevorld |
| ggDoubleHeat | A heatmap-like visualization tool | visualization, geoms | https://github.com/PursuitOfDataScience/ggDoubleHeat/ | PursuitOfDataScience | https://github.com/PursuitOfDataScie nce |
| nflplotR | ‘nflplotR’ provides a set of functions to visualize National Football League a nalysis in ‘ggplot2’. | general,scales,geoms,images,theme,elements | https://github.com/nflverse/nflplotR/ | mrcaseb | https://github.com/mrcaseb |
| ggbraid | Braid ribbons in <code highlighter-rouge”>ggp lot2</code>. | visualization,general,geoms | https://github.com/nsgrantham/ggbraid/ | nsgrantham | https://github.com/nsgrantham |
| ggblanket | Simplify ggplot2 visualisation | visualization | https://github.com/davidhodge931/ggblanket/ | davidhodge931 | https://github.com/davidhodge931 |
| ggpie | Create pie and donut plot using <code highligh ter-rouge”>ggplot2</code>. | visualization,general,pie,donut,rose pie | https://github.com/showteeth/ggpie/ | showteeth | https://github.com/showteeth |
| ggstar | Multiple Geometric Shape Point Layer for ‘ggplot2’ | visualization, different shape points | https://github.com/xiangpin/ggstar/ | xiangpin | https://github.com/xiangpin |
| ggarchery | Flexible segment geoms with arrows for ‘ggplot2’ | visualization, arrows | https://github.com/mdhall272/ggarchery/ | mdhall272 | https://github.com/mdhall272 |
| tidyterra | ‘ggplot2’ geoms for ‘terra’ rasters and vectors | visualization, raster, spatial | https://github.com/dieghernan/tidyterra/ | dieghernan | https://github.com/dieghernan |
| ggseqplot | ‘ggseqplot’ renders sequence plots using ggplot2. | visualization,sequence analysis | https://github.com/maraab23/ggseqplot/ | maraab23 | https://github.com/maraab23 |
| ggsurvfit | Flexible Time-to-Event Figures | visualization,survival,statistics | https://github.com/ddsjoberg/ggsurvfit/ | ddsjoberg | https://github.com/ddsjoberg |
| ggsector | Create sector plots using <code highlighter-rou ge”>ggplot2</code>. | visualization, geoms, sector, fan | https://github.com/yanpd01/ggsector/ | yanpd01 | https://github.com/yanpd01 |
| ggterror | Create T-errorbars like in THAT paper | visualization, geoms | https://github.com/mivalek/ggterror/ | mivalek | https://github.com/mivalek |
参考资料:
1.https://exts.ggplot2.tidyverse.org/gallery/
