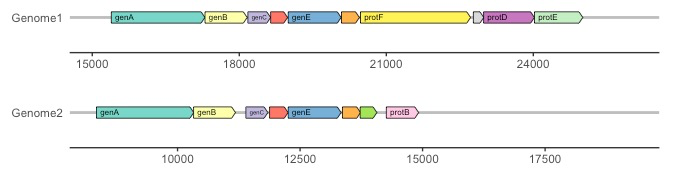
ggplot2系列发展至今已经形成了非常庞大的生态圈,其中gggenes是一个绘制基因结构图的好助手,和ggplot2嵌套使用。用法也非常简单,下面可以简要说明其使用:
library(ggplot2)
# 安装:install.packages("gggenes")
# 安装开发版:devtools::install_github("wilkox/gggenes")
library(gggenes)
其中gggenes自身附带了演示数据:
head(example_genes)

- molecule:基因组信息
- gene: 基因名
- start: 基因在基因组开始位置
- end: 基因结束位置
- strand: 基因属于正/负(反)条链
- orientation: 基因绘制方向
library(ggplot2)
# 安装:install.packages("gggenes")
library(gggenes)

# 查看演示数据
head(example_genes)

# 绘图
ggplot(example_genes,
       # 定义坐标轴信息
       aes(
         xmin = start,
         xmax = end,
         y = molecule,
         fill = gene,
         label = gene
       )) +
  # 定义基因箭头信心
  geom_gene_arrow(arrowhead_height = unit(3, "mm"),
                  arrowhead_width = unit(1, "mm")) +
  # 定义基因标签
  geom_gene_label(align = "left") +
  # 分面,每个基因组分别绘制
  facet_wrap( ~ molecule, scales = "free", ncol = 1) +
  # 颜色设置
  scale_fill_brewer(palette = "Set3") +
  theme_genes()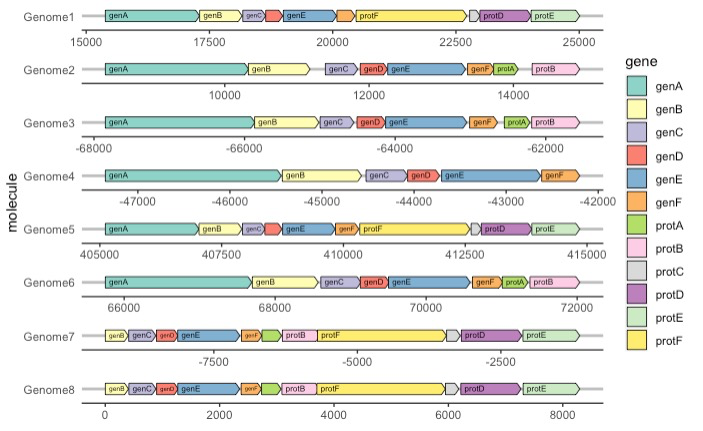
还有更多的个性化绘制参数,比如:显示基因的指定区域,如外显子、或翻译为特定功能域的区域等都是可以的,具体可以参看参考资料学习、了解。
参考资料:
1.https://wilkox.org/gggenes/index.html
