散点图的绘制是相对简单的,之前也用R介绍了各样的散点图绘制,其中有一种蜂群图(或散点图、抖动图、蜜蜂图),可以无重叠的呈现所有数据信息尤为让数据分析者青睐。
下面利用seaborn实现快速绘制蜜蜂图的绘制:
import matplotlib.pyplot as plt
import seaborn as sns

# 设置绘图样式
sns.set(style="white", palette="muted", color_codes=True)

# 加载数据
df = sns.load_dataset("penguins")

# 查看penguins数据集
print(df.head())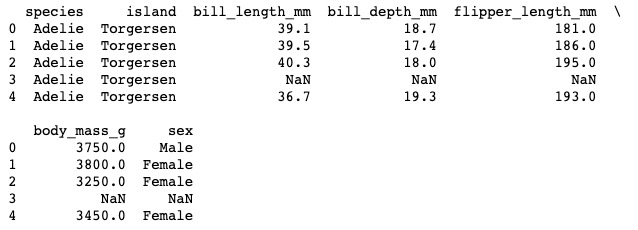
# 绘图
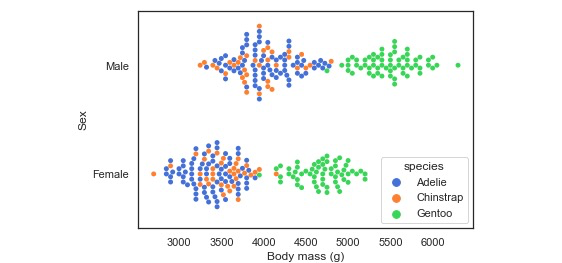
ax = sns.swarmplot(data=df, x="body_mass_g", y="sex", hue="species")
# 设置坐标轴标题
ax.set(ylabel="Sex", xlabel="Body mass (g)")如此,蜜蜂图就绘制完成了。
参考资料:
1.http://seaborn.pydata.org/examples/scatterplot_categorical.html
