对于一般集合数据可视化,我们首先想到的就是用韦恩图。绘制韦恩图的软件也有很多,如: venneuler 、VennDiagram等,但是当我们的韦恩图集合超过三个以上的时候展示起来就很困难,看的眼花缭乱了 ,如下:

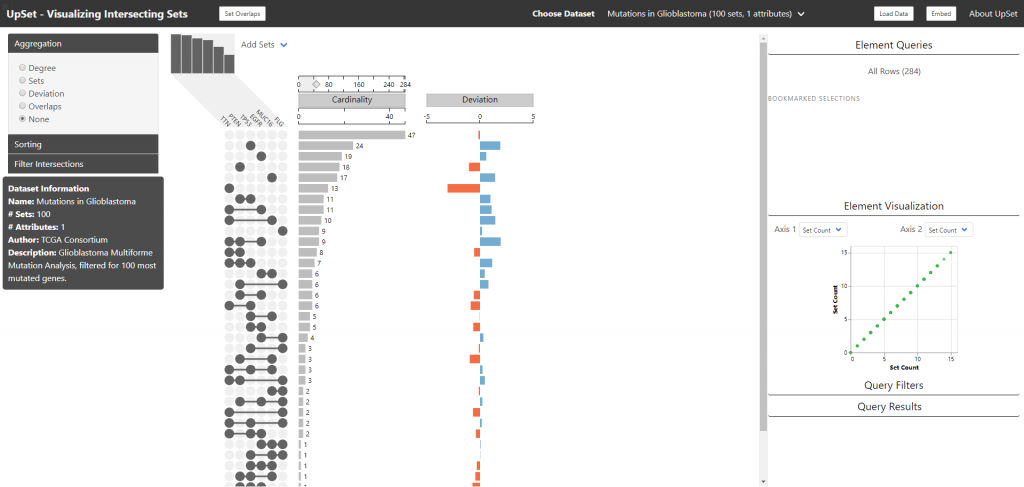
为了解决这种困境, UpSetR提供了一种新的思路来展示集合数据的可视化:

解释如下:
- 黑色点表示该区域是有数据且上方的条形图是该区域的数值大小,灰色的点表示该区域没有数据;
- 不同点连线表示存在交集,交集的数量在上方的条形图看出;
- 不同类型的数据的总量在左边的条形图展示
如此,当数据集合超过三个也能很清晰的看出来,现在被广泛的用于基因组,多组学等数据集合中,部分文章发表在CNS中。
安装 UpSetR 很简单:
# 正式版
install.packages("UpSetR")
# 开发板/最新版
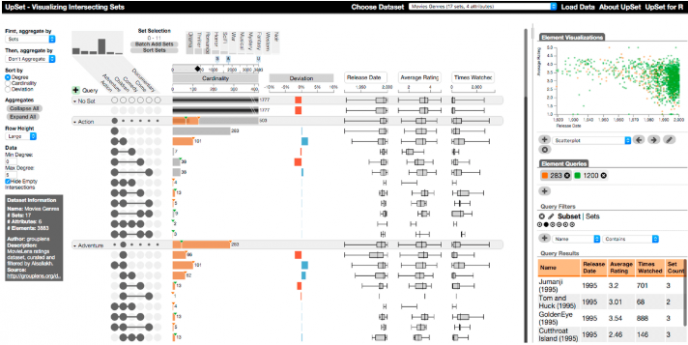
devtools::install_github("hms-dbmi/UpSetR")当然,作者也提供了Web应用:https://vdl.sci.utah.edu/upset2/

一个R代码示例( 参考官方 )
# 一个复杂但实用的示例
library(UpSetR)
library(ggplot2)
library(ggthemes)
library(plyr)
library(gridExtra)
library(grid)

# 演示数据
movies <-
    read.csv(
        system.file("extdata", "movies.csv", package = "UpSetR"),
        header = TRUE,
        sep = ";"
    )

# 判断发布时间
between <- function(row, min, max) {
    newData <- (row["ReleaseDate"] < max) & (row["ReleaseDate"] > min)
}

# 绘制柱状图
plot1 <- function(mydata, x) {
    myplot <- (
        ggplot(mydata, aes_string(x = x, fill = "color"))
        + geom_histogram() + scale_fill_identity()
        + theme_few()
        + theme(plot.margin = unit(c(0.2, 0.2, 0.2, 0.2), "cm"))
    )
}
# 绘制散点图
plot2 <- function(mydata, x, y) {
    myplot <-
        (
            ggplot(
                data = mydata,
                aes_string(x = x, y = y, colour = "color"),
                alpha = 0.5
            )
            + geom_point() + scale_color_identity()
            + theme_few()
            + theme(plot.margin = unit(c(0.2, 0.2, 0.2, 0.2), "cm"))
        )
}
# 编辑upsetR子图属性
attributeplots <- list(
    gridrows = 55,
    plots = list(
        list(plot = plot1, x = "ReleaseDate",  queries = FALSE),
        list(plot = plot1, x = "ReleaseDate", queries = TRUE),
        list(
            plot = plot2,
            x = "ReleaseDate",
            y = "AvgRating",
            queries = FALSE
        ),
        list(
            plot = plot2,
            x = "ReleaseDate",
            y = "AvgRating",
            queries = TRUE
        )
    ),
    ncols = 4
)
# 绘图
upset(
    movies,
    attribute.plots = attributeplots,
    queries = list(
        list(query = between, params = list(1920, 1940)),
        list(
            query = intersects,
            params = list("Drama"),
            color = "red"
        ),
        list(
            query = elements,
            params = list("ReleaseDate", 1990, 1991, 1992)
        )
    ),
    main.bar.color = "skyblue"
)
参考资料:
1.https://github.com/hms-dbmi/UpSetR
2.http://caleydo.org/tools/upset/
3.https://www.r-bloggers.com/2019/04/set-analysis-a-face-off-between-venn-diagrams-and-upset-plots

 浙公网安备 33010802011761号