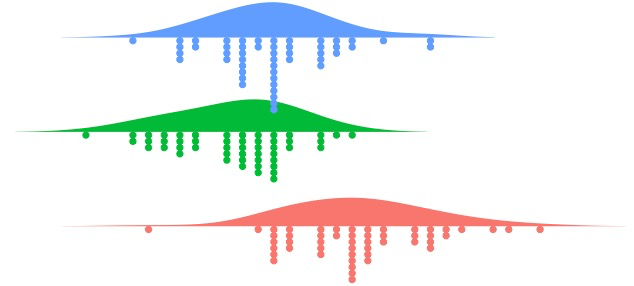
云雨图是一个很形象的说法,是因为可视化的展示图形很像云朵+下雨,故而有了雨云图,如下:
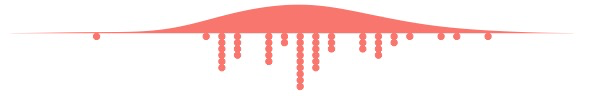
剖析其原理,是上半部分是又一个小提琴图绘制,下半部分是由点图组成,然后拼接而成。Y叔在18年左右的文章《(翻)云(覆)雨图》曾经剖析过云雨图的绘制,本次给大家介绍用gghalves快速绘制云雨图,其也是ggplot2生态圈中的一员。
安装gghalves:
if (!require(devtools)) {
    install.packages('devtools')
}
devtools::install_github('erocoar/gghalves')
gghalves支持下面三种半边图绘制:
geom_half_boxplotgeom_half_violingeom_half_point
通过上面几种方式,我们可以拼接出各种炫酷的可视化方案,下面一云雨图为例,简单展示:
library(tidyverse)
library(gghalves)
library(ggthemes)

# 绘图
ggplot(iris, aes(x = Species, y = Sepal.Width, fill = Species)) +
  # 半边小提琴图
  geom_half_violin(
    aes(fill = Species),
    adjust = 1.5,
    trim = FALSE,
    colour = NA,
    # 展示小提琴图左边(l),右边(r)
    side = 'r',
    show.legend = F
  ) +
  # 半边点图
  geom_dotplot(
    aes(color = Species),
    binaxis = "y",
    method = "histodot",
    stackdir = "down",
    dotsize = 0.4,
    shape=18,
    show.legend = F
  ) +
  # 翻转x、y轴
  coord_flip() +
  theme_few()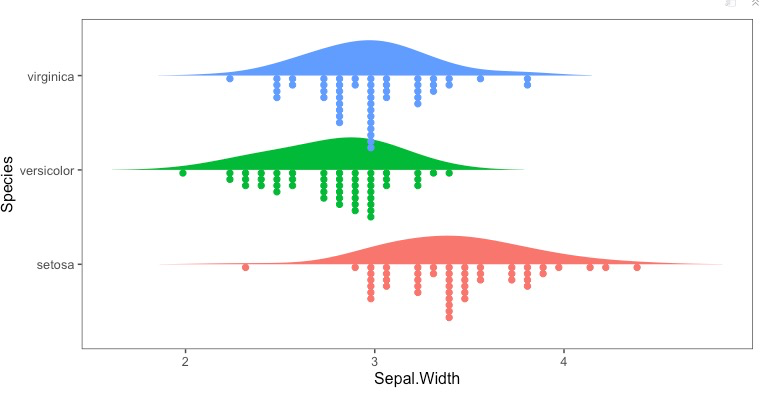
组合图是未来高分杂志的首选,现在文章发表不仅仅要求论文本身的质量,还要求有新颖的可视化方案。
参考资料:
1.https://erocoar.github.io/gghalves/
2.https://guangchuangyu.github.io/cn/2018/11/raincloud/
