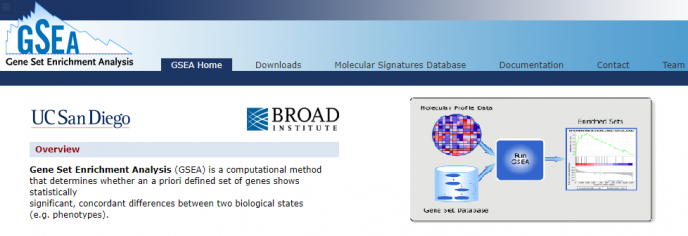
Gene Set Enrichment Analysis( GSEA )是一种基于基因功能 / 通路的富集分析方法。首先基于基因表达数据的变化的大小进行排序,然后对选定的或者自定义的Gene Set进行富集,最后计算一个富集打分( ES Score),这种分析方法可以很好的对某一通路、功能进行研究,避免了直接计算P值而忽略一些重要的基因信息,同时分析是按照某一组功能进行分析并非单个基因的分析更可能反应真实的情况,网上现在关于GSEA的介绍也很多,本文主要介绍如何用R快速进行GSEA分析。
官网:https://www.gsea-msigdb.org/gsea/index.jsp

同时官方也支持各种平台下的Java版程序:
| GSEA v4.1.0 Mac App | Download and unzip the Mac App Archive, then double-click the GSEA application to run it. You can move the app to the Applications folder, or anywhere else. | download GSEA_4.1.0.app.zip |
|---|---|---|
| GSEA v4.1.0 for Windows | Download and run the installer. A GSEA shortcut will be created on the Desktop; double-click it to run the application. 64-bit Windows is required | download GSEA_Win_4.1.0-installer.exe |
| GSEA v4.1.0 for Linux | Download and unzip the Archive. See the included readme.txt for further instructions. 64-bit Linux is required | download GSEA_Linux_4.1.0.zip |
| GSEA v4.1.0 for the command line (all platforms) | Download and unzip the Archive. See the included readme.txt for further instructions. Requires separate Java 11 installation. | download GSEA_4.1.0.zip |
| GSEA v4.1.0 Java Web Start (all platforms) | Launches the GSEA desktop application from the web. Requires separate Java 8 installation. Please use a configuration smaller than your computer’s total memory. This option will be removed in a future release. | Launch with 1GB (for 32 or 64-bit Java) 2GB (for 64-bit Java only) 4GB (for 64-bit Java only) 8GB (for 64-bit Java only) |
同时官网也提供了常用的Gene Set数据库:https://www.gsea-msigdb.org/gsea/downloads.jsp#msigdb
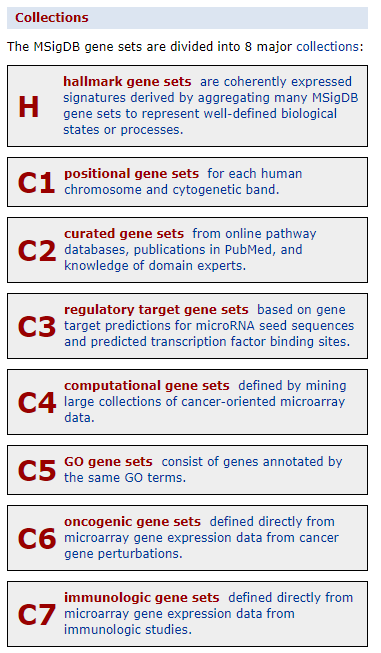
目前官方提供了H和C1~C7共8个数据集,目前数据库更新到 MSigDB 7.1版本,分析时建议采用最新的数据库进行富集分析。
同时建议分析时最好不要用所有的数据集来进行分析( 当然如果你不知道你研究的功能或者需要海选的时候可以这么做,否则这一步很消耗时间,同时对擅长用R的小伙伴我这里根据官方的R 2005脚本略作修改, 适配R3.5.3版本)
安装R版GSEA
# 安装
library("devtools")
install_github("ewail/GSEA_R")
GSEA函数如下:
GSEA(input.ds, input.cls, input.chip = "NOCHIP", gene.ann = "", gs.db,
  gs.ann = "", output.directory = getwd(),
  doc.string = "gsea_result", reshuffling.type = "sample.labels",
  nperm = 1000, weighted.score.type = 1, nom.p.val.threshold = -1,
  fwer.p.val.threshold = -1, fdr.q.val.threshold = 0.25, topgs = 20,
  adjust.FDR.q.val = F, gs.size.threshold.min = 15,
  gs.size.threshold.max = 500, reverse.sign = F, preproc.type = 0,
  random.seed = as.integer(Sys.time()), perm.type = 0, fraction = 1,
  replace = F, collapse.dataset = FALSE,
  collapse.mode = "NOCOLLAPSE", save.intermediate.results = F,
  use.fast.enrichment.routine = T, gsea.type = "GSEA",
  rank.metric = "S2N")
我们现在主要分析像转录组等NGS数据,很少有chip的数据,所以这写参数里面主要有三个需要我们提供:
input.ds:基因表达矩阵
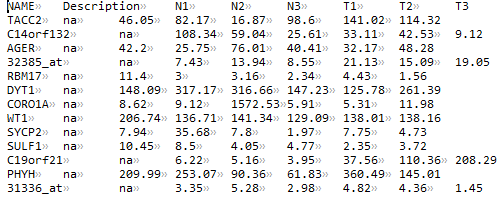
注意需要包含NAME和Description列,列名也需要一致,其他各列为每个样本/数据的表达值
input.cls:表型矩阵
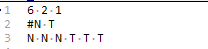
第一行:样本数/分组数/1
第二行:分组名
第三行:分组信息(此处展示一个3V3的示例)
gs.db:富集数据库,可以从 https://www.gsea-msigdb.org/gsea/downloads.jsp#msigdb 下载,也可以自己制作
# 一个简单的分析示例
library(GSEA)
GSEA(input.ds = "demo.txt", input.cls = "demo.cls", gs.db = "c2.cp.kegg.v7.0.symbols.gmt")
分析结束后会在当前目录下生成各个通路的富集分析结果
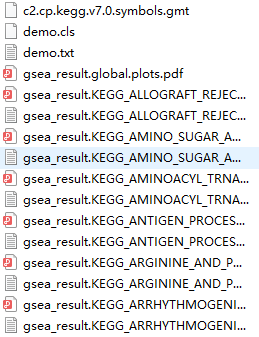
我们以其中一个作为示例
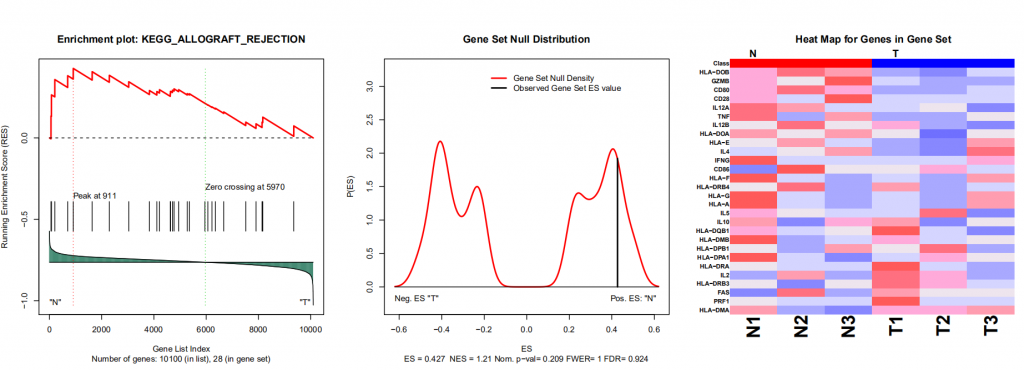
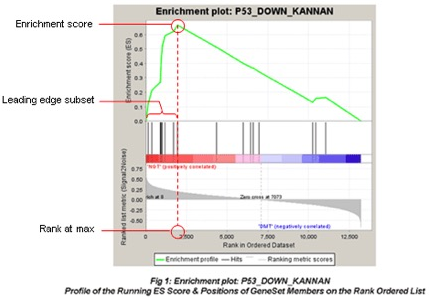
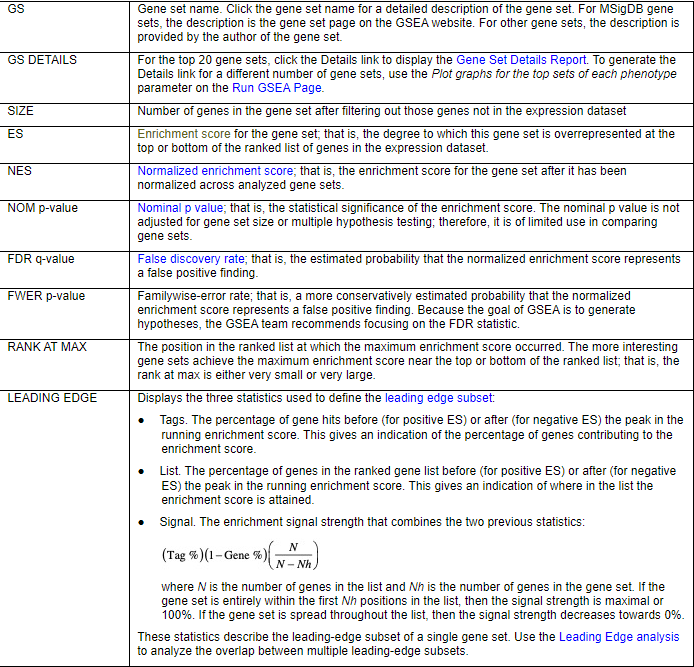
关于左图的介绍可以查看下面官方手册配图:
我们可以看到输出的图片和表格,可以看出该基因在该通路是否属于关键的被富集到的基因。
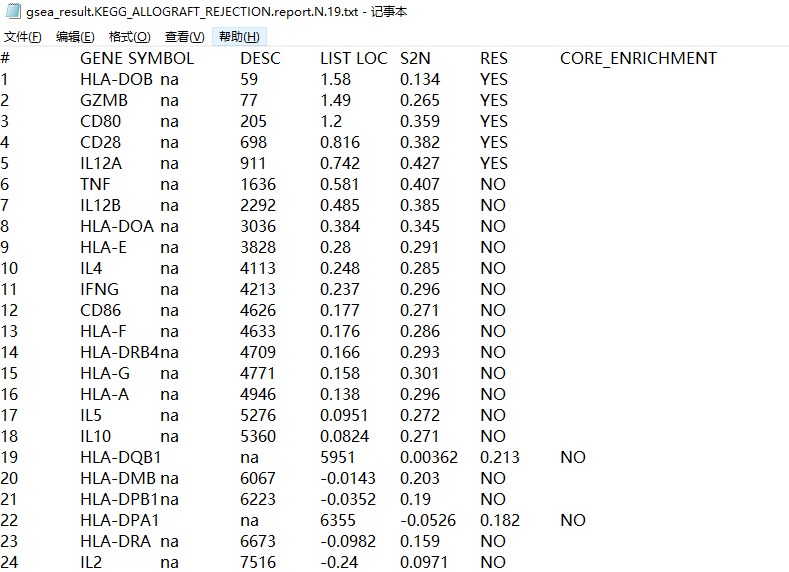
同时也会输出一个Gene Set 的详细的Report
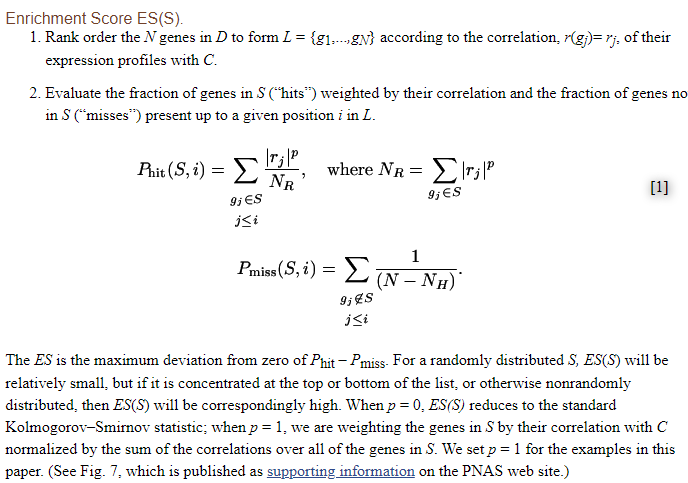
关于ES( 大家可以查看论文学习,PMC1239896;或者通过搜索引擎查阅 ),此处涉及较多统计学知识,如果有需要后续可以详细总结。
参考资料:
1.https://www.gsea-msigdb.org/gsea/index.jsp
2.https://www.gsea-msigdb.org/gsea/doc/GSEAUserGuideFrame.html
3.https://www.ncbi.nlm.nih.gov/pmc/articles/PMC1239896/

zhangfangfie
你这些不能复制
陈浩
你好,推荐自己动手操作,文章代码仅仅做演示。