Consensus Clustering(一致性聚类)方法被广泛用于基于亚群鉴定,癌症分型等研究方向。一致性聚类是利用重采样的方法打乱原始数据集,这样对每一次重采样的样本进行聚类分析最后再综合评估多次聚类分析的结果给出一致性(Consensus)的评估。
下面简单介绍如何用R进行简单的一致性聚类,这里我们主要利用ConsensusClusterPlus包进行数据聚类:
# 安装R包
if (!requireNamespace("BiocManager", quietly = TRUE))
    install.packages("BiocManager")

BiocManager::install("ConsensusClusterPlus")
分析代码如下:
# 加载必备的R包
library(ConsensusClusterPlus)
library(pheatmap)
library(Biobase)
library(dplyr)
# 加载演示数据
data(geneData)
# 数据按行取中位数
df <- sweep(geneData, 1, apply(geneData, 1, median))
# 运行标准consensus cluster方法
rcc <-
ConsensusClusterPlus(
df,
maxK = 10, # 最大聚类数,按照实际情况调整
reps = 100,
pItem = 0.8,
pFeature = 1,
seed = 2020,
title = "example",
distance = "pearson",
clusterAlg = "hc"
)
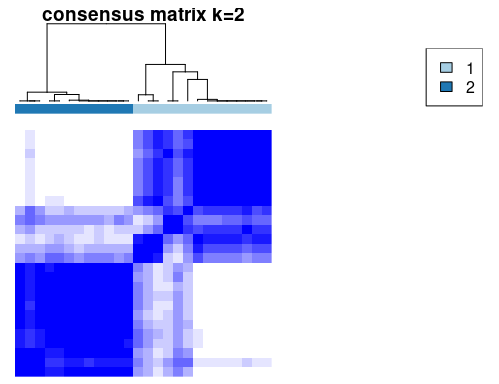
# 提取聚类值, 用pheatmap绘图rcc[[2]]$consensusMatrix
# 本示例主要利用K=2演示
# rcc对象包含一致性聚类矩阵,分类标签,颜色等信息
data2 <- data.frame(rcc[[2]]$consensusMatrix, row.names = colnames(df))
colnames(data2) <- colnames(df)
anno2 <- as.data.frame(rcc[[2]]$consensusClass)
colnames(anno2) <- c("Cluster")
anno2$Cluster <- as.factor(anno2$Cluster)
anno2 <- arrange(anno2, Cluster)
pheatmap(
data2[ ,row.names(anno2)],
color = colorRampPalette(c("white", "blue"))(10),
# consensus聚类方法
clustering_method = "average",
show_rownames = F,
show_colnames = T,
cluster_cols = T,
cluster_rows = T,
annotation_col = anno2,
annotation_colors = list(
Cluster = c('1' = "#1F78B4", '2' = "#A6CEE3")),
border_color = "white",
clustering_distance_rows = "correlation",
clustering_distance_cols = "correlation",
angle_col = 0
)
pheatmap(
rcc[[3]]$consensusMatrix,
color = colorRampPalette(c("blue", "white"))(50),
clustering_distance_rows = "correlation",
clustering_distance_cols = "correlation"
)
pheatmap(
rcc[[4]]$consensusMatrix,
color = colorRampPalette(c("blue", "white"))(50),
clustering_distance_rows = "correlation",
clustering_distance_cols = "correlation"
)
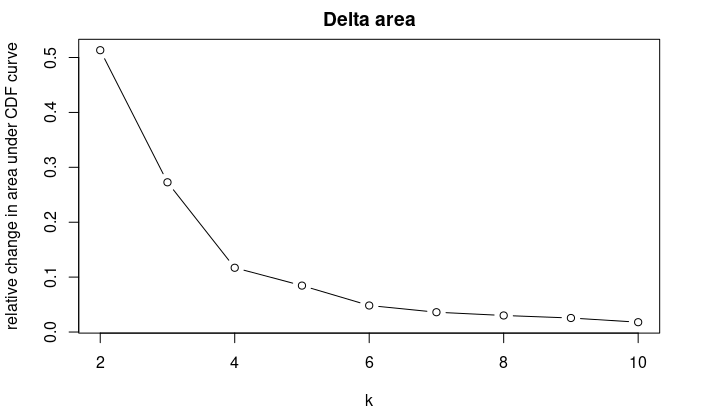
我们可以根据下面的累计分布图来选择一个最佳的分类数:
网上也有代码说根据用ecdf 方法生成拟合曲线计算0.1到0.9之间的面积,面积最小者为最佳值,也有朋友建议根据Delta area拐点来判断。个人建议是结合数据本身含义以及Delta area的拐点,接近平缓的K值应该为最佳K:

下图展示了我们用pheatmap重新绘制了ConsensusClusterPlus输出的热图,可自己做更多的定制。

参考资料:
1.http://www.bioconductor.org/packages/release/bioc/html/ConsensusClusterPlus.html
2.https://blog.csdn.net/YJJ18636810884/article/details/83242090
