
标准误、标准差、置信区间是做生物统计的基础,下面我们简单说说这几者的区别和绘图方式。
标准差(Standard Deviation):标准差,缩写为S.D., SD, 或者 s,是描述数据点在均值(mean)周围聚集程度的指标,反映个体变异。
标准误差(Standard Error): 标准误差,缩写为S.E., SE, 样本平均数与总体平均数之间的相对误差,标准误越小,说明样本平均数与总体平均数越接近;否则,表明样本平均数比较离散。
置信区间(Confidence Interval):置信区间又称估计区间, 缩写为CI, 置信区间是指由样本统计量所构造的总体参数的估计区间。
下面我们展示如何在柱状图上加上它们:
# 加载包
library(tidyverse)
library(ggthemes)
library(patchwork)

# 演示数据
data <- iris

# 计算 mean, sd, se 和 ci
my_sum <- data %>%
    group_by(Species) %>%
    summarise(
        n = n(),
        mean = mean(Sepal.Length),
        # 计算标准差
        sd = sd(Sepal.Length)
    ) %>%
    # 计算标准误、置信区间
    mutate(se = sd / sqrt(n)) %>%
    mutate(ic = se * qt((1 - 0.05) / 2 + .5, n - 1))

# 标准误
p1 <- ggplot(my_sum) +
    geom_bar(
        aes(x = Species, y = mean),
        stat = "identity",
        color = "black",
        fill = "black",
        alpha = 0.7,
        width = 0.5
    ) +
    # 添加误差线(添加上半段)
    geom_errorbar(
        aes(
            x = Species,
            ymin = mean,
            ymax = mean + se
        ),
        width = 0.2,
        colour = "black",
        alpha = 0.9,
        size = 0.5
    ) +
    ggtitle("standard error") +
    theme(plot.title = element_text(size = 6)) +
    theme_few() +
    # y轴设置0起始
    scale_y_continuous(expand = c(0, 0), limits = c(0, 10), breaks = c(0, 5, 10)) +
    xlab("") +
    ylab("Sepal Length")

# 标准差
p2 <- ggplot(my_sum) +
    geom_bar(
        aes(x = Species, y = mean),
        stat = "identity",
        fill = "black",
        alpha = 0.7,
        width = 0.5
    ) +
    geom_errorbar(
        aes(
            x = Species,
            ymin = mean,
            ymax = mean + sd
        ),
        width = 0.2,
        colour = "black",
        alpha = 0.9,
        size = 0.5
    ) +
    ggtitle("standard deviation") +
    theme(plot.title = element_text(size = 6)) +
    theme_few() +
    scale_y_continuous(expand = c(0, 0), limits = c(0, 10), breaks = c(0, 5, 10)) +
    xlab("") +
    ylab("Sepal Length")

# 置信区间
p3 <- ggplot(my_sum) +
    geom_bar(
        aes(x = Species, y = mean),
        stat = "identity",
        fill = "black",
        alpha = 0.7,
        width = 0.5
    ) +
    geom_errorbar(
        aes(
            x = Species,
            ymin = mean,
            ymax = mean + ic
        ),
        width = 0.2,
        colour = "black",
        alpha = 0.9,
        size = 0.5
    ) +
    ggtitle("confidence interval") +
    theme(plot.title = element_text(size = 6)) +
    theme_few() +
    scale_y_continuous(expand = c(0, 0), limits = c(0, 10), breaks = c(0, 5, 10)) +
    xlab("") +
    ylab("Sepal Length")

p1 + p2 + p3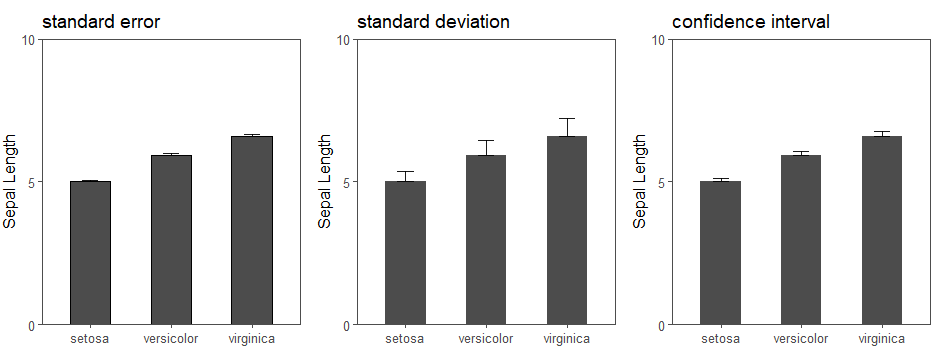
如此一个简单的分析做好了,建议读者可以自己动手试试。
参考资料:
1.https://www.data-to-viz.com/caveat/error_bar.html
