igraph是一个简单易用,功能强大的网络数据处理框架,可以在R,Python, C语言中实现网络的可视化和数据挖掘,本文以R为例简单介绍其使用方法。
在Network中对应的数据结构为
1.图(graph), 通常用大写字母G表示
2.顶点的英文为vertex, 用大写字母V表示
3.边的英文为edge, 用大写字母E表示。
下面以一个具体示例说明:
# 加载包
library(igraph)
library(RColorBrewer)
# 演示数据
links <- data.frame(
source = c("A", "A", "A", "A", "A", "J", "B", "B", "C", "C", "D", "I"),
target = c("B", "B", "C", "D", "J", "A", "E", "F", "G", "H", "I", "I"),
importance = (sample(1:4, 12, replace = T))
)
nodes <- data.frame(name = LETTERS[1:10],
carac = c(rep("young", 3), rep("adult", 2), rep("old", 5)))
# 转换成igraph对象
network <-
graph_from_data_frame(d = links,
vertices = nodes,
directed = F)
# 生成颜色向量
coul <- brewer.pal(3, "Set1")
my_color <- coul[as.numeric(as.factor(V(network)$carac))]
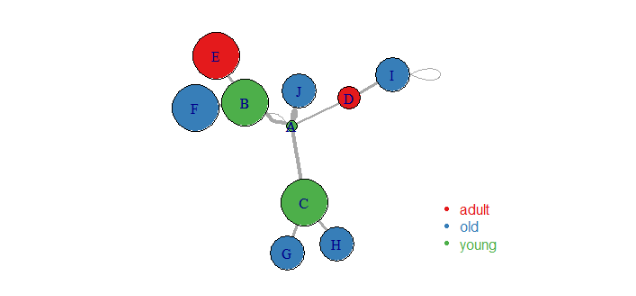
# 绘图
plot(
network,
vertex.color = my_color,
edge.width = E(network)$importance,
vertex.size = E(network)$importance*12
)
# 添加图注
legend(
"bottomright",
legend = levels(as.factor(V(network)$carac)),
col = coul ,
bty = "n",
pch = 20 ,
pt.cex = 1,
cex = 1,
text.col = coul ,
horiz = FALSE,
inset = c(0.1, 0.1)
)
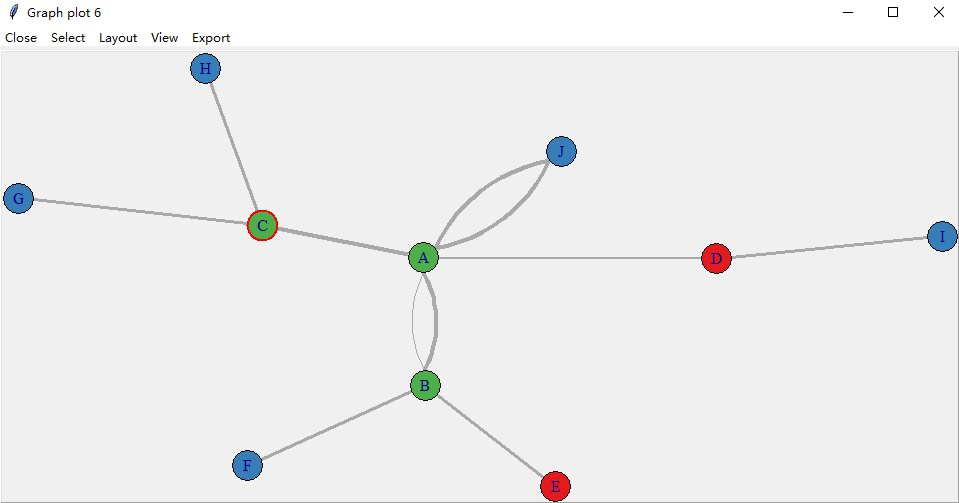
如果我们希望生成可交互的图可以用tkplot
# 交互式网络图
tkplot(network,
    vertex.color = my_color,
    edge.width = E(network)$importance
)
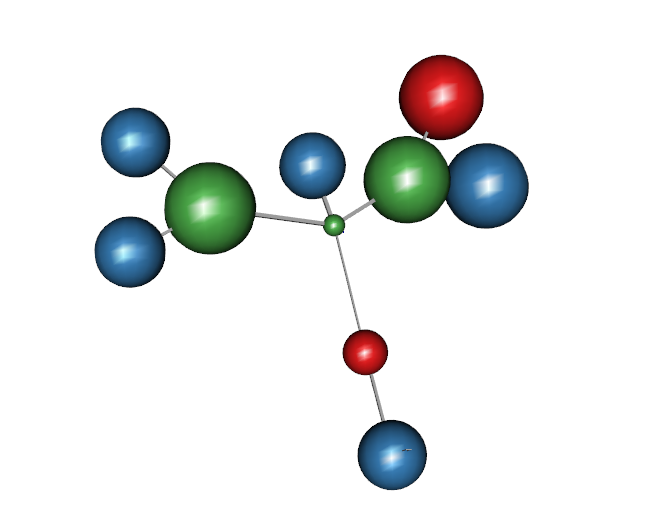
同时我们也可以生成3D网络图:
# 3D网络图
rglplot(network,
    vertex.color = my_color,
    edge.width = E(network)$importance,
    vertex.size = c(E(network)$importance*12)
)
本次介绍就到这里了,其他更多请参考下方参考资料。
参考资料:
1.https://igraph.org/r/
2.https://www.r-graph-gallery.com/249-igraph-network-map-a-color.html
