Treemap适合展现具有层级关系的数据,能够直观体现同级之间的比较。我们常见的是堆叠式的Treemap,如下图:

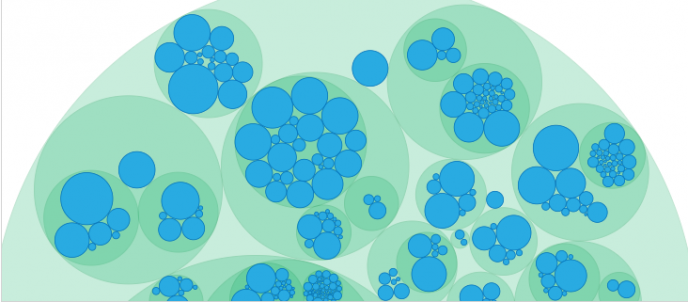
表达的是一个层级树的概念,我们常规用上图做Treemap,最近一些CNS文章用另种方式来呈现Treemap,总体效果非常好,我们先看看圆形Treemap的一个转换方式:

也是Treemap的一个变种,但是其含义和可视化效果要比开始的Treemap要直观很多,下面我们介绍如何用R绘制,R用 circlepackeR 来绘制:
# devtools::install_github("jeromefroe/circlepackeR")
library(circlepackeR)
library(data.tree)
library(treemap)

data(GNI2014)
head(GNI2014)

GNI2014$pathString <- paste("world",
                            GNI2014$continent,
                            GNI2014$country,
                            sep = "/")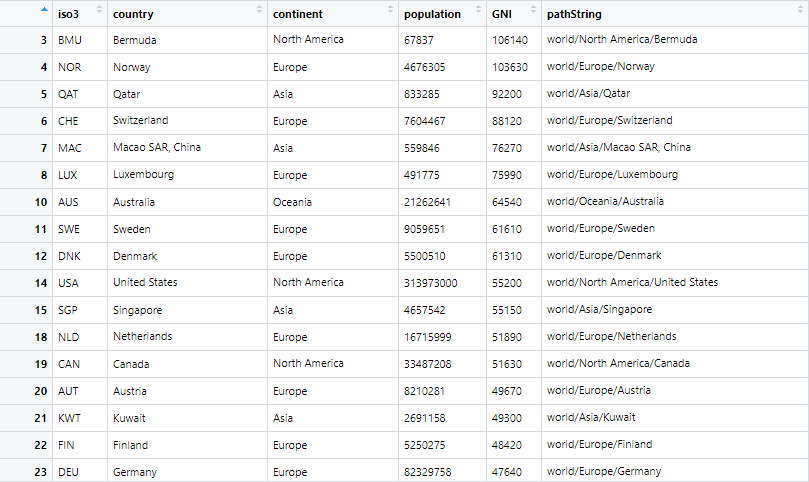
# 将数据结构转换成data.tree结构
population <- as.Node(GNI2014)

circlepackeR(population, size = "population", color_min = "hsl(56,80%,80%)",
             color_max = "hsl(341,30%,40%)")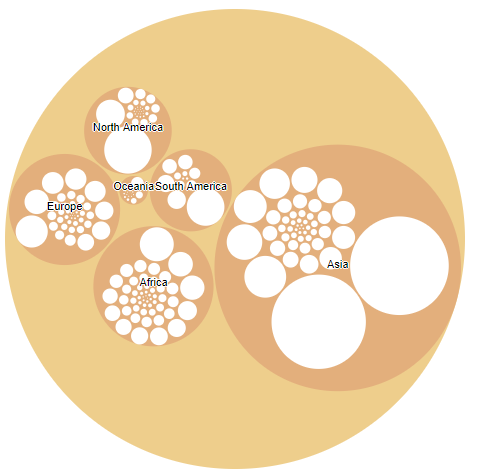
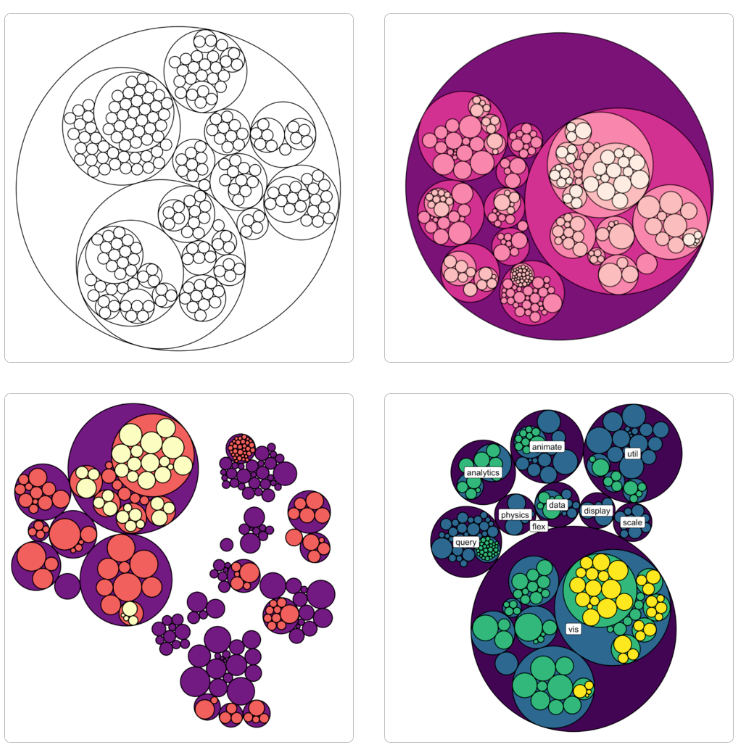
更多探索,需要读者动手查看官方文档,更多美图欣赏:
参考资料:
1.https://datavizcatalogue.com/methods/circle_packing.html
2.https://www.r-graph-gallery.com/circle-packing.html
