R绘图中,ggstatsplot包可谓是科研神器,可以绘制很多复杂的高大上的统计图形。
主要功能:
| 函数 | 图形 | Description |
|---|---|---|
| ggbetweenstats | violin plots | for comparisons between groups/conditions |
| ggwithinstats | violin plots | for comparisons within groups/conditions |
| gghistostats | histograms | for distribution about numeric variable |
| ggdotplotstats | dot plots/charts | for distribution about labeled numeric variable |
| ggpiestats | pie charts | for categorical data |
| ggbarstats | bar charts | for categorical data |
| ggscatterstats | scatterplots | for correlations between two variables |
| ggcorrmat | correlation matrices | for correlations between multiple variables |
| ggcoefstats | dot-and-whisker plots | for regression models and meta-analysis |
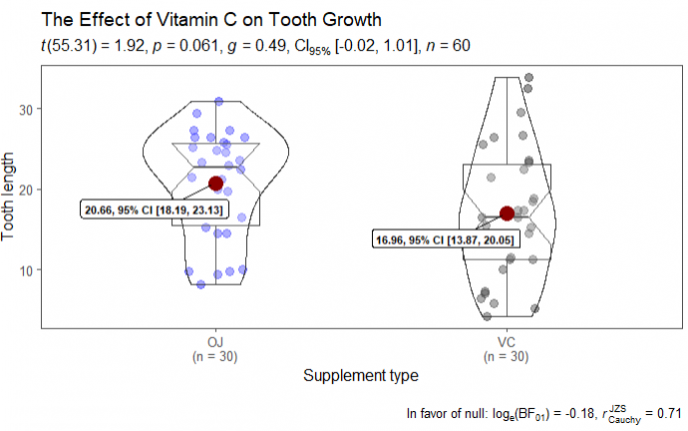
此包功能强大,具体不详细介绍,大家可以去官网查看。最近遇到一个问题,就是我想指定 ggstatsplot 绘制的小提琴颜色,但是默认给的参数貌似没有修改点的颜色。默认图如下:
# 加载必备的绘图包
set.seed(2020)
library(ggstatsplot)
library(ggplot2)
library(ggthemes)

# 绘图
ggbetweenstats(
  data = ToothGrowth,       # 采用系统牙齿的数据
  x = supp,
  y = len,
  notch = T,                # 盒状图显示缺口
  mean.ci = T,              # 显示均值的置信区间
  k = 2,                    # 结果保留几位小数
  outlier.tagging = TRUE,   # 是否需要标记离群值
  outlier.label = dose,     # 用于离群值标记的变量
  xlab = "Supplement type", # X轴标签
  ylab = "Tooth length",    # Y轴标签
  title = "The Effect of Vitamin C on Tooth Growth",
  ggtheme = theme_few(),    # 绘图主题,可以从ggthemes中选择,也可以自定义
  ggstatsplot.layer = FALSE,# 关闭 `ggstatsplot` 主题图层
  package = "wesanderson",  # 选择用于调色板的R包
  palette = "Darjeeling1",  # 调色板
  messages = FALSE
)
由于 ggstatsplot 是ggplot2的扩展包,我们需要修改点的颜色,可以像修改ggplot2点的颜色一样指定,利用scale_colour_manual来改变其颜色,示例如下:
# 加载必备的绘图包
set.seed(2020)
library(ggstatsplot)
library(ggplot2)
library(ggthemes)

# 绘图
ggbetweenstats(
  data = ToothGrowth,       # 采用系统牙齿的数据
  x = supp,
  y = len,
  notch = T,                # 盒状图显示缺口
  mean.ci = T,              # 显示均值的置信区间
  k = 2,                    # 结果保留几位小数
  outlier.tagging = TRUE,   # 是否需要标记离群值
  outlier.label = dose,     # 用于离群值标记的变量
  xlab = "Supplement type", # X轴标签
  ylab = "Tooth length",    # Y轴标签
  title = "The Effect of Vitamin C on Tooth Growth",
  ggtheme = theme_few(),    # 绘图主题,可以从ggthemes中选择,也可以自定义
  ggstatsplot.layer = FALSE,# 关闭 `ggstatsplot` 主题图层
  package = "wesanderson",  # 选择用于调色板的R包
  palette = "Darjeeling1",  # 调色板
  messages = FALSE
) +
################划重点################
  scale_colour_manual(values = c("VC" = "blue", "OJ"= "black")) # 改变点颜色

对于ggplot2的所有扩展系列或者基于ggplot2开发的包都可以利用ggplot2相关参数进行调整。
参考文章:
1.https://github.com/IndrajeetPatil/ggstatsplot

 浙公网安备 33010802011761号