cowplot也是ggplot2家族中的一员,其主要目的是为ggplot2提供一个出版级的图片绘制解决方案,使用少量代码即可实现主题统一的修改,如轴标签大小、画图背景、图片拼接、标注等等。
# 安装
install.packages("cowplot")本文主要关注图片的拼接方式,cowplot是非常便捷的。使用其自带的draw_plot函数可以实现ggplot2图片对象的快速拼接。
# draw_plot用法
draw_plot(plot, x = 0, y = 0, width = 1, height = 1, scale = 1,
  hjust = 0, vjust = 0)
# 参数介绍
plot	ggplot2等对象

x	x轴位置

y	y轴位置

width	图片宽度

height	图片高度

scale	缩放比例

hjust	x轴相对位置

vjust	y轴相对位置
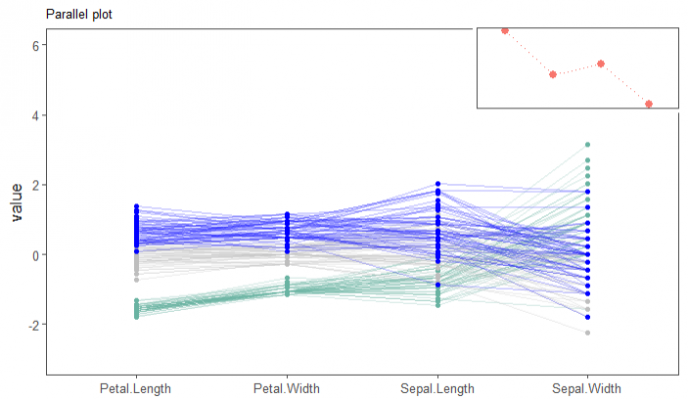
下面一个简单示例做演示:
library(ggplot2)
library(cowplot)
library(ggthemes)
library(dplyr)
library(GGally)


# 演示数据
data <- iris
# 求均值
mean <- data.frame(value = apply(data[, 1:4], 2, mean),
                   name = colnames(data[, 1:4]))

# 绘图
plot1 <- data %>%
    ggparcoord(
        columns = 1:4,
        groupColumn = 5,
        order = "anyClass",
        # 用于缩放变量的方法
        scale = "robust",
        showPoints = T,
        title = "Parallel plot",
        alphaLines = 0.3
    ) +
    # 设置颜色
    scale_color_manual(values = c("#69b3a2", "grey", "blue")) +
    # 主题设置
    theme_few() +
    theme(legend.position = "Default",
          plot.title = element_text(size = 10)) +
    # 坐标轴范围
    ylim(-3, 6) +
    xlab("")

# 绘图
plot2 <- mean %>%
    ggplot(aes(x=factor(name, levels = name), y=value, colour = "red", group = 1)) +
    geom_line(linetype="dotted") +
    geom_point(size=4, shape=20) +
    # 主题设置
    theme_few() +
    theme(
        legend.position = "none",
        axis.ticks = element_blank(),
        axis.title = element_blank(),
        axis.text = element_blank(),
        plot.margin = margin(0, 0, 0, 0)
    )

# 图片拼接
ggdraw() +
    draw_plot(plot1,
              0,
              0,
              1,
              1) +
    draw_plot(plot2,
              # 相对位置
              0.6889,
              0.735,
              # 长宽比例
              0.3,
              0.2)

参考资料:
1.https://cran.r-project.org/web/packages/cowplot/vignettes/introduction.html
2.https://github.com/wilkelab/cowplot
3.https://wilkelab.org/cowplot/index.html

 浙公网安备 33010802011761号