GraphPad Prism是专为科学研究而创建的首选统计分析和图形可视化解决方案,其绘图风格很受大众欢迎,但是GraphPad Prism是商业软件,如果使用非正版软件会有侵权风险。
ggprism就是一个基于R的软件包,软件包提供了各种漂亮的发表级主题,也包括了类似“ GraphPad Prism”的主题。
下面介绍介绍其安装及使用方法:
1)安装
# 安装最新稳定版
install.packages("ggprism")
# 安装开发版
remotes::install_github("csdaw/ggprism")
2)绘图示例
# 小提琴图
library(ggplot2)
library(ggprism)

tg <- ToothGrowth
tg$dose <- as.factor(tg$dose)

# 绘制基础小提琴图
base <- ggplot(tg, aes(x = dose, y = len)) +
  geom_violin(aes(colour = dose, fill = dose), trim = FALSE) +
  geom_boxplot(aes(fill = dose), width = 0.2, colour = "black") +
  scale_y_continuous(limits = c(-5, 40))

# 添加p值标签
p_vals <- tibble::tribble(
  ~group1, ~group2, ~p.adj,   ~y.position,
  "0.5",   "1",     8.80e-14, 35,
  "0.5",   "2",     1.27e-7,  39
)

base

# 设置主题“theme_prism”
base +
  scale_color_prism("floral") +
  scale_fill_prism("floral") +
  guides(y = "prism_offset_minor") +
  theme_prism(base_size = 16) +
  theme(legend.position = "none") +
  add_pvalue(p_vals, label = "p = {p.adj}", tip.length = 0, label.size = 4)
# 比较默认主题和theme_prism主题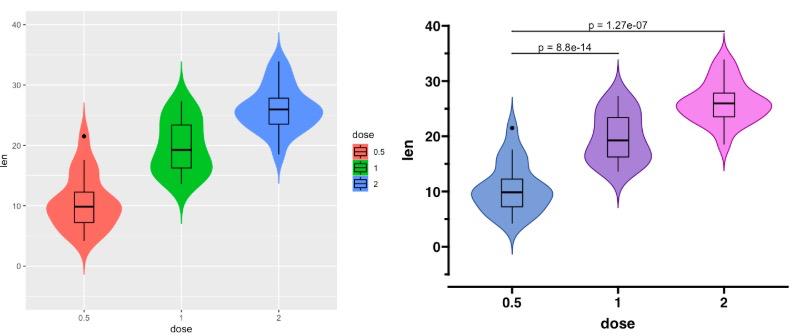
# 柱状图
library(ggplot2)
library(ggprism)
library(patchwork)

p1 <- ggplot(ToothGrowth, aes(x = factor(dose), y = len)) +
  stat_summary(aes(fill = factor(dose)), na.rm = TRUE,
               geom = "col", fun = mean, colour = "black", size = 0.9) +
  scale_y_continuous(limits = c(0, 30), expand = c(0, 0))

p2 <- p1 + theme_prism(base_size = 14)

p1 + p2
# 比较theme_grey()和 theme_prism()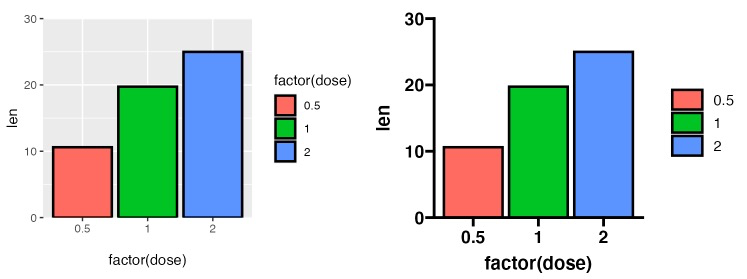
# 盒状图
library(ggplot2)
library(ggprism)
library(patchwork)

p <- ggplot(ToothGrowth, aes(x = factor(supp), y = len)) +
  geom_boxplot(aes(colour = factor(supp), fill = factor(supp))) +
  theme_prism(base_size = 14)

p1 <- p + scale_colour_prism(palette = "floral") +
  scale_fill_prism(palette = "floral")

p2 <- p + scale_colour_prism(palette = "flames") +
  scale_fill_prism(palette = "flames")

p1 + p2
# 比较theme_prism不同的色卡及填充色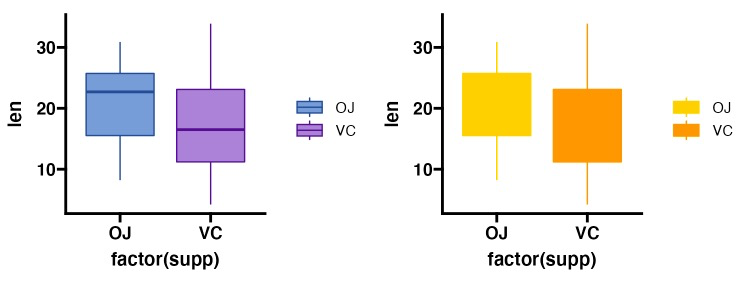
# 坐标轴个性化
library(ggplot2)
library(ggprism)
library(patchwork)

p <- ggplot(ToothGrowth, aes(x = factor(dose), y = len)) +
  geom_jitter(aes(shape = factor(dose)), width = 0.2, size = 2) +
  scale_shape_prism() +
  theme_prism() +
  theme(legend.position = "none")

p1 <- p + scale_y_continuous(limits = c(0, 40), guide = "prism_minor")

p2 <- p + scale_x_discrete(guide = "prism_bracket") +
  scale_y_continuous(limits = c(0, 40))

p3 <- p + scale_y_continuous(limits = c(0, 40), guide = "prism_offset")

p4 <- p + scale_y_continuous(limits = c(0, 40), guide = "prism_offset_minor")

(p1 + p2) / (p3 + p4)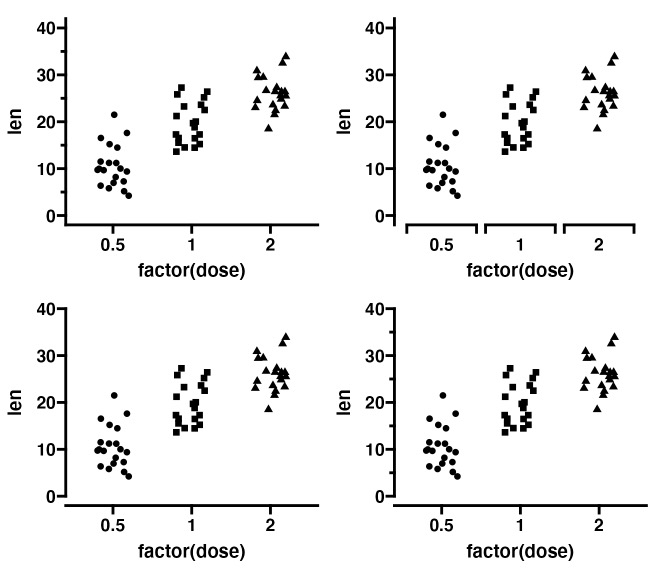
3)GraphPad Prism图实操

# GraphPad Prism风格
library(ggplot2)
library(ggprism)
library(ggnewscale)
library(dplyr)
library(tidyr)

# 演示数据集
df <- data.frame(
  agonist = c(1e-10, 1e-8, 3e-8, 1e-7, 3e-7, 1e-6, 3e-6, 1e-5, 3e-5, 1e-4, 3e-4),
  ctr1 = c(0, 11, 125, 190, 258, 322, 354, 348, NA, 412, NA),
  ctr2 = c(3, 33, 141, 218, 289, 353, 359, 298, NA, 378, NA),
  ctr3 = c(2, 25, 160, 196, 345, 328, 369, 372, NA, 399, NA),
  trt1 = c(3, NA, 11, 52, 80, 171, 289, 272, 359, 352, 389),
  trt2 = c(5, NA, 25, 55, 77, 195, 230, 333, 306, 320, 338),
  trt3 = c(4, NA, 28, 61, 44, 246, 243, 310, 297, 365, NA)
) %>%
  mutate(log.agonist = log10(agonist)) %>%
  pivot_longer(
    c(-agonist, -log.agonist),
    names_pattern = "(.{3})([0-9])",
    names_to = c("treatment", "rep"),
    values_to = "response"
  ) %>%
  filter(!is.na(response))

# 拟合线
dose_resp <- y ~ min + ((max - min) / (1 + exp(hill_coefficient * (ec50 - x))))

ggplot(df, aes(x = log.agonist, y = response)) +
  geom_smooth(
    aes(colour = treatment),
    method = "nls", formula = dose_resp, se = FALSE,
    method.args = list(start = list(min = 1.67, max = 397, ec50 = -7, hill_coefficient = 1))
  ) +
  scale_colour_manual(labels = c("No inhibitor", "Inhibitor"),
                      values = c("#00167B", "#9FA3FE")) +
  ggnewscale::new_scale_colour() +
  geom_point(aes(colour = treatment, shape = treatment), size = 3) +
  # ggprism配色设置
  scale_colour_prism(palette = "winter_bright",
                     labels = c("No inhibitor", "Inhibitor")) +
  # ggprism形状设置
  scale_shape_prism(labels = c("No inhibitor", "Inhibitor")) +
  # ggprism主题设置
  theme_prism(palette = "winter_bright", base_size = 16) +
  scale_y_continuous(limits = c(-100, 500),
                     breaks = seq(-100, 500, 100),
                     guide = "prism_offset") +
  # 坐标轴
  scale_x_continuous(
    limits = c(-10, -3),
    breaks = -10:-3,
    guide = "prism_offset_minor",
    minor_breaks = log10(rep(1:9, 7)*(10^rep(-10:-4, each = 9))),
    labels = function(lab) {
      do.call(
        expression,
        lapply(paste(lab), function(x) bquote(bold("10"^.(x))))
      )
    }
  ) +
  # 主题设置
  theme(axis.title.y = element_blank(),
        legend.title = element_blank(),
        legend.position = c(0.05, 0.95),
        legend.justification = c(0.05, 0.95)) +
  labs(x = "[Agonist], M")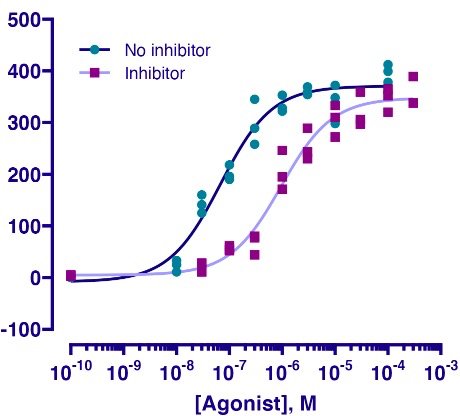
ggprism的还有很多绘图主题,大家可以参考官文学习了解。
参考资料:
1.https://github.com/csdaw/ggprism/
2. https://csdaw.github.io/ggprism/articles/ggprism.html
