一般我们利用ggplot2绘图时,在绘图命令中加上geom_text()或者geom_label()即可为条形图添加数据标签,需要分别指定一个变量映射给x、y和标签本身。
有时我们想给标签进行进一步美化,如下:

上面这种是一些unicode字符,我们如果想利用上面数字作为标签需要指定字体,如:sans-serif、PingFangSC-Regular等
下面通过简单示例演示如何给ggplot2图像文件添加特殊数字标签:
library(ggplot2)
library(ggthemes)
# 演示数据
df <- data.frame(
x = factor(c(1, 1, 2, 2)),
y = c(1, 3, 2, 1),
# unicode 标签
z = c("❶", "⓷", "㊁","⑴"),
grp = c("a", "b", "a", "b")
)
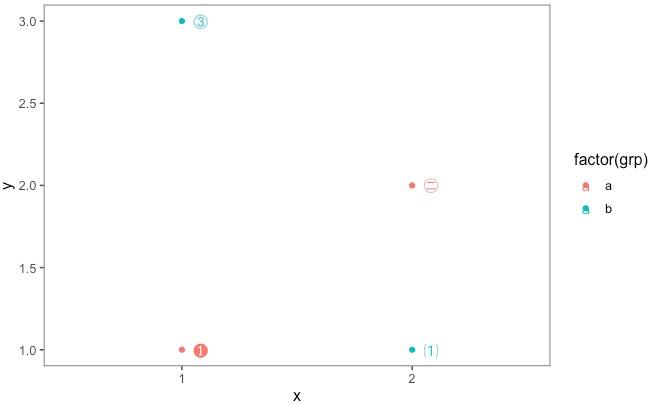
p <- ggplot(df, aes(x, y, group = grp))
# 点图
p + geom_point(aes(colour = factor(grp))) +
# 添加标签
geom_text(
data = df,
# 选中z变量
aes(label = z, colour = factor(grp)),
hjust = 0,
nudge_x = 0.05,
# 选择字体
family = "PingFangSC-Regular"
) + theme_few()
# 柱状图
p + geom_bar(stat = "identity",
             position = "dodge",
             aes(fill = factor(grp))) +
  geom_text(
    data = df,
    aes(label = z),
    hjust = 0.5,
    nudge_y = 0.1,
    family = "PingFangSC-Regular"
  ) + theme_few()
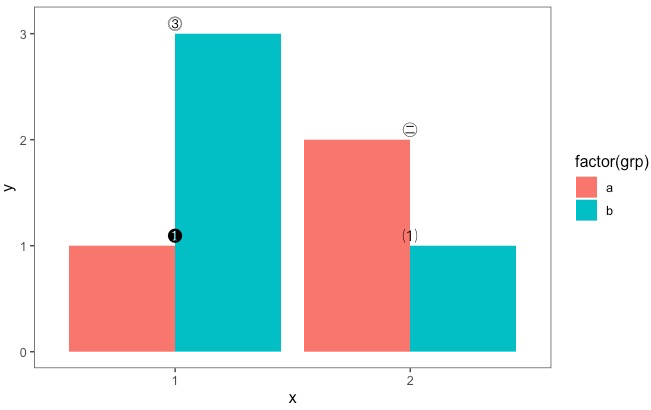
其中我们用到了c(“❶”, “⓷”, “㊁”,”⑴”)特殊字符。本绘图的关键点是字体库是否支持,建议对family进行了解,后续也可以添加中文等任何unicode字符。
参考资料:
1.https://ggplot2.tidyverse.org/reference/index.html
