常用做相关性热图的R包有很多,像corrplot、PerformanceAnalytics等
本次主要介绍一款用ggplot2来做相关性可视化热图的包:ggcorrplot
安装:
install.packages("ggcorrplot")帮助说明:
ggcorrplot(corr, method = c("square", "circle"), type = c("full",
  "lower", "upper"), ggtheme = ggplot2::theme_minimal, title = "",
  show.legend = TRUE, legend.title = "Corr", show.diag = FALSE,
  colors = c("blue", "white", "red"), outline.color = "gray",
  hc.order = FALSE, hc.method = "complete", lab = FALSE,
  lab_col = "black", lab_size = 4, p.mat = NULL, sig.level = 0.05,
  insig = c("pch", "blank"), pch = 4, pch.col = "black",
  pch.cex = 5, tl.cex = 12, tl.col = "black", tl.srt = 45,
  digits = 2)
示例:
data(mtcars)
corr <- round(cor(mtcars), 1)
head(corr[, 1:6])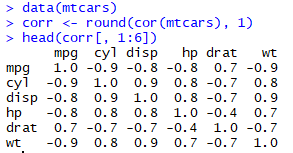
ggcorrplot(corr, method = "circle")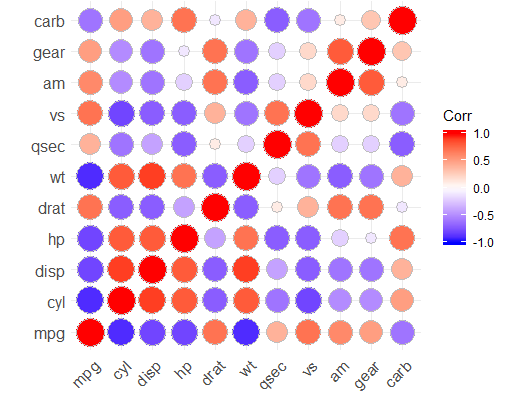
ggcorrplot(corr, method = "circle", hc.order = TRUE, type = "lower",
   lab = TRUE) # lab 添加数值标签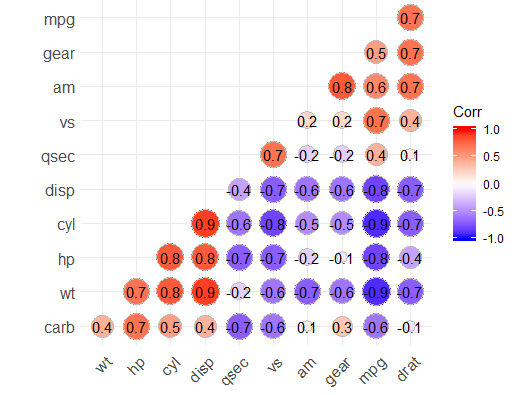
更多细节可以查看ggcorrplot帮助说明。
参考资料:
1.http://www.sthda.com/english/wiki/ggcorrplot-visualization-of-a-correlation-matrix-using-ggplot2
2.https://www.rdocumentation.org/packages/ggcorrplot/versions/0.1.3
